Mapping the Behaviour Economy
Research & Visualisation — Cloud Computing
Project Description
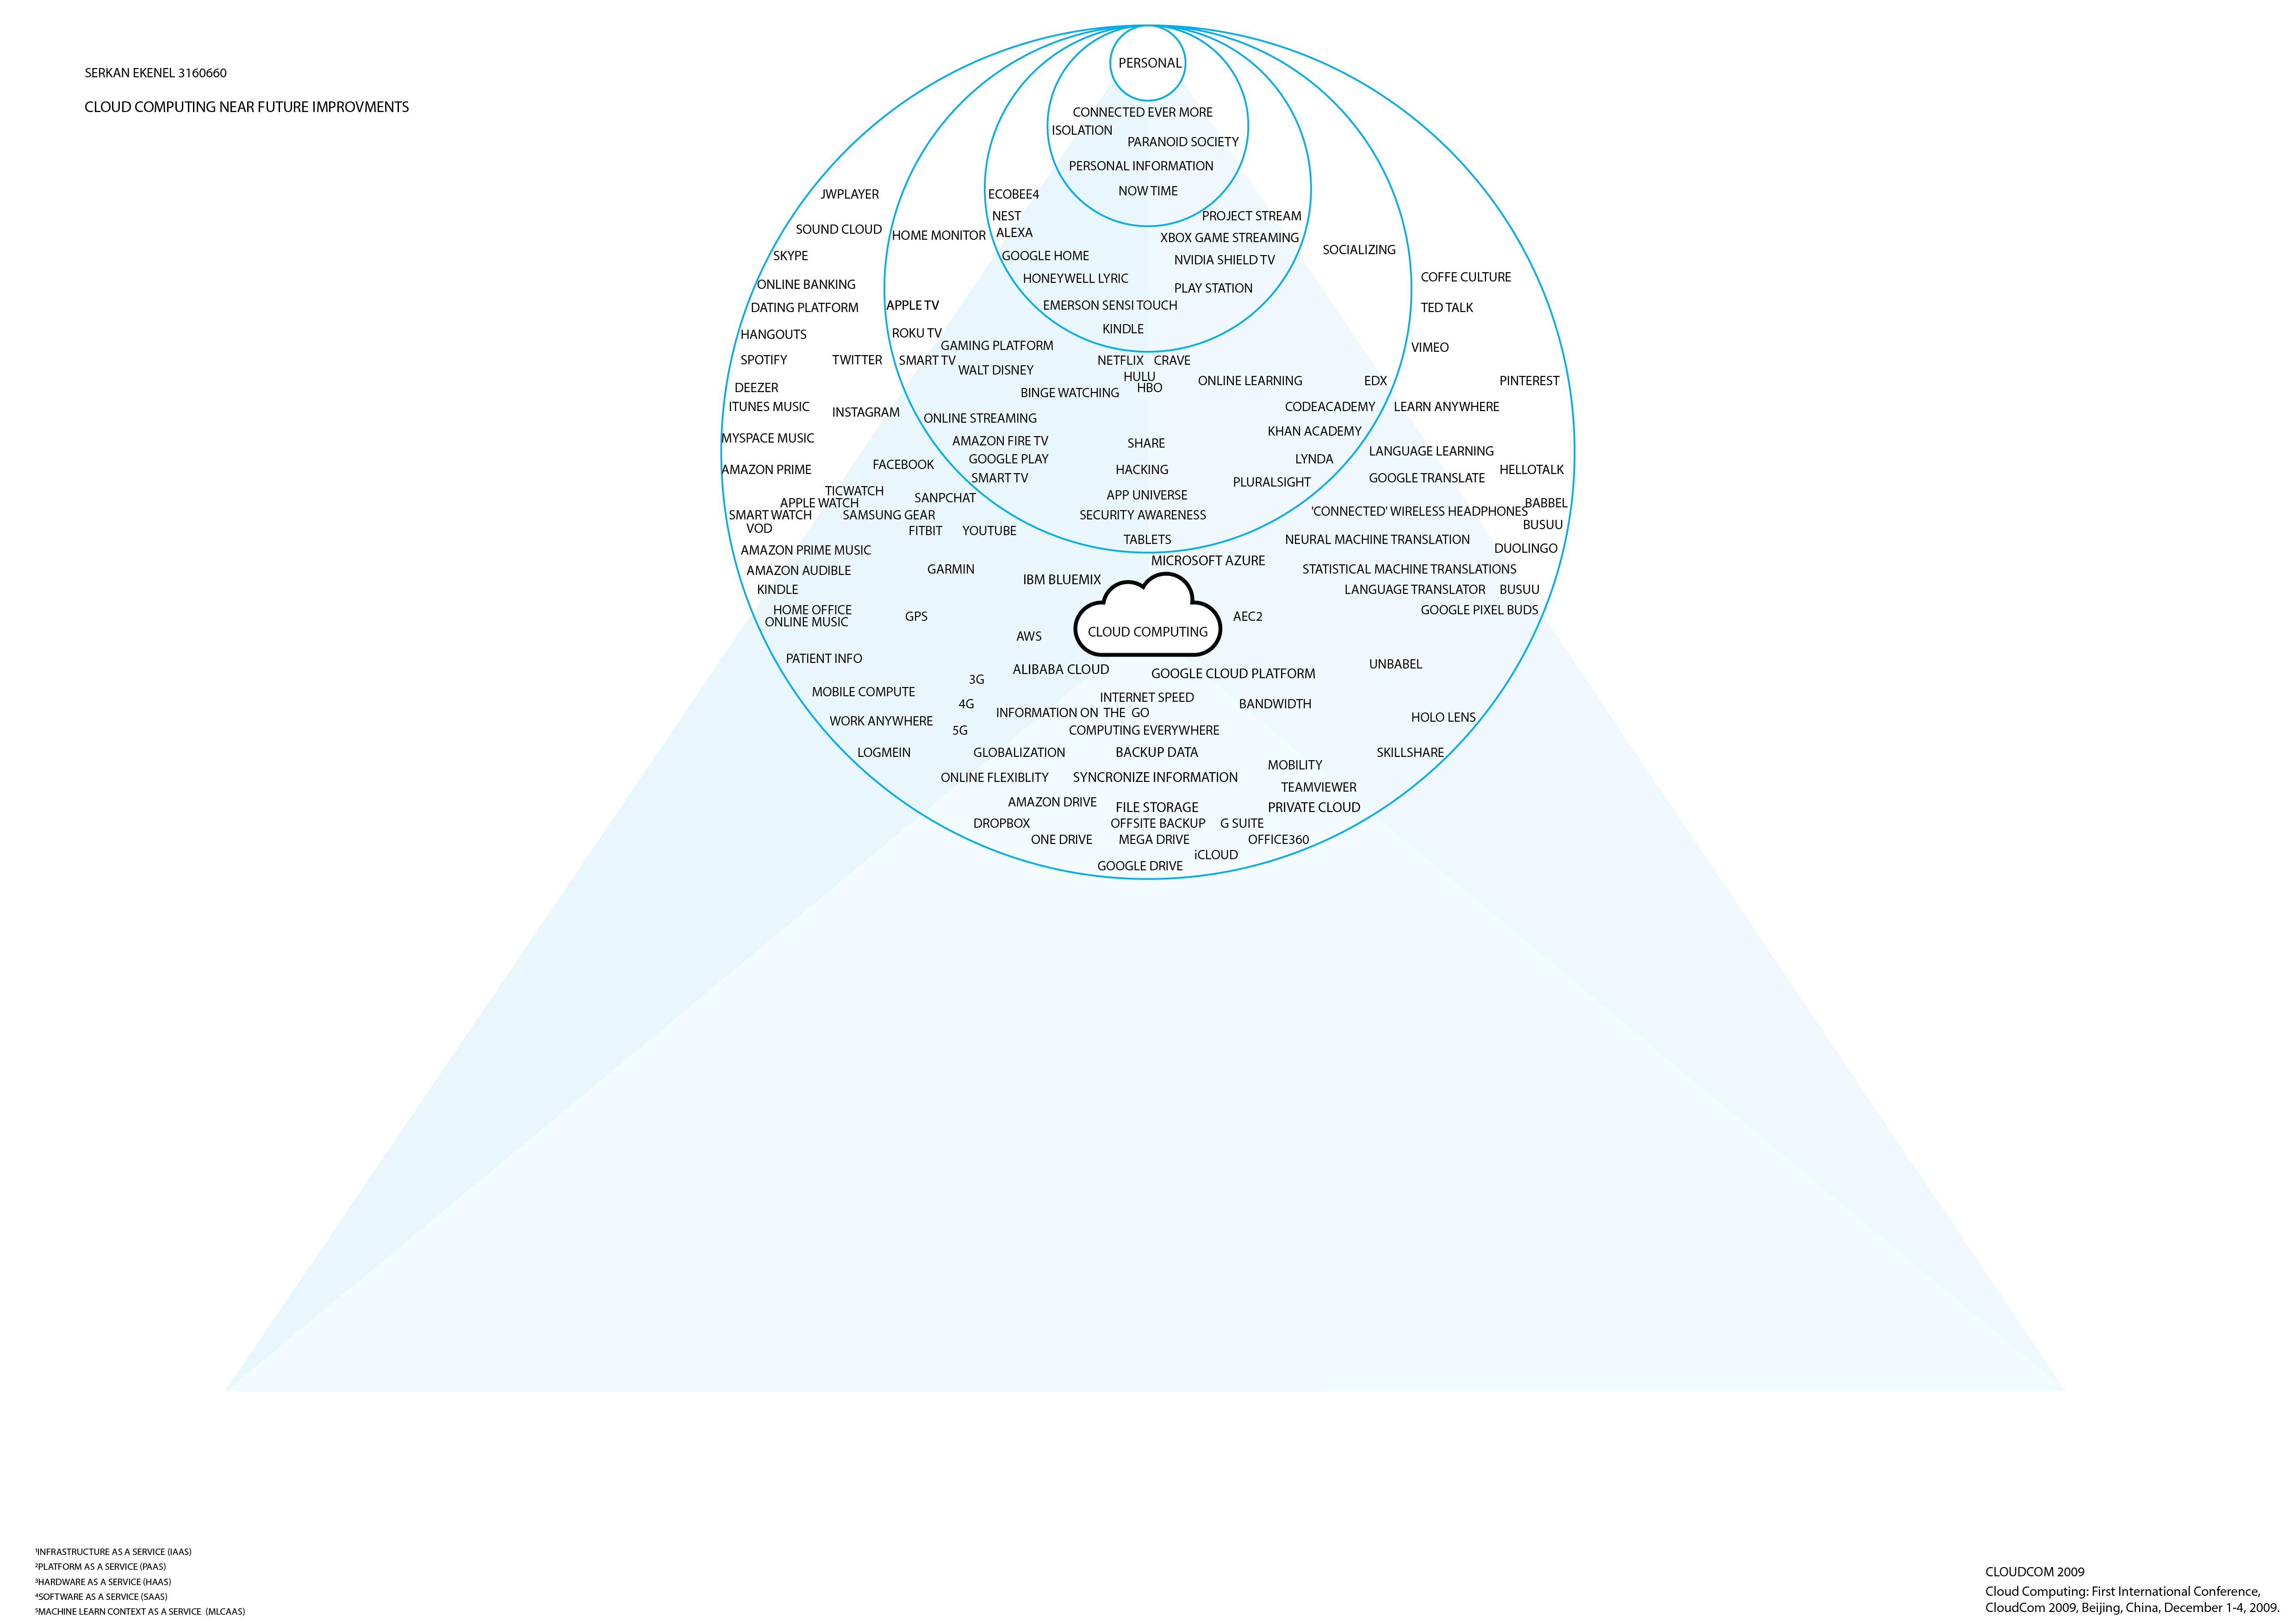
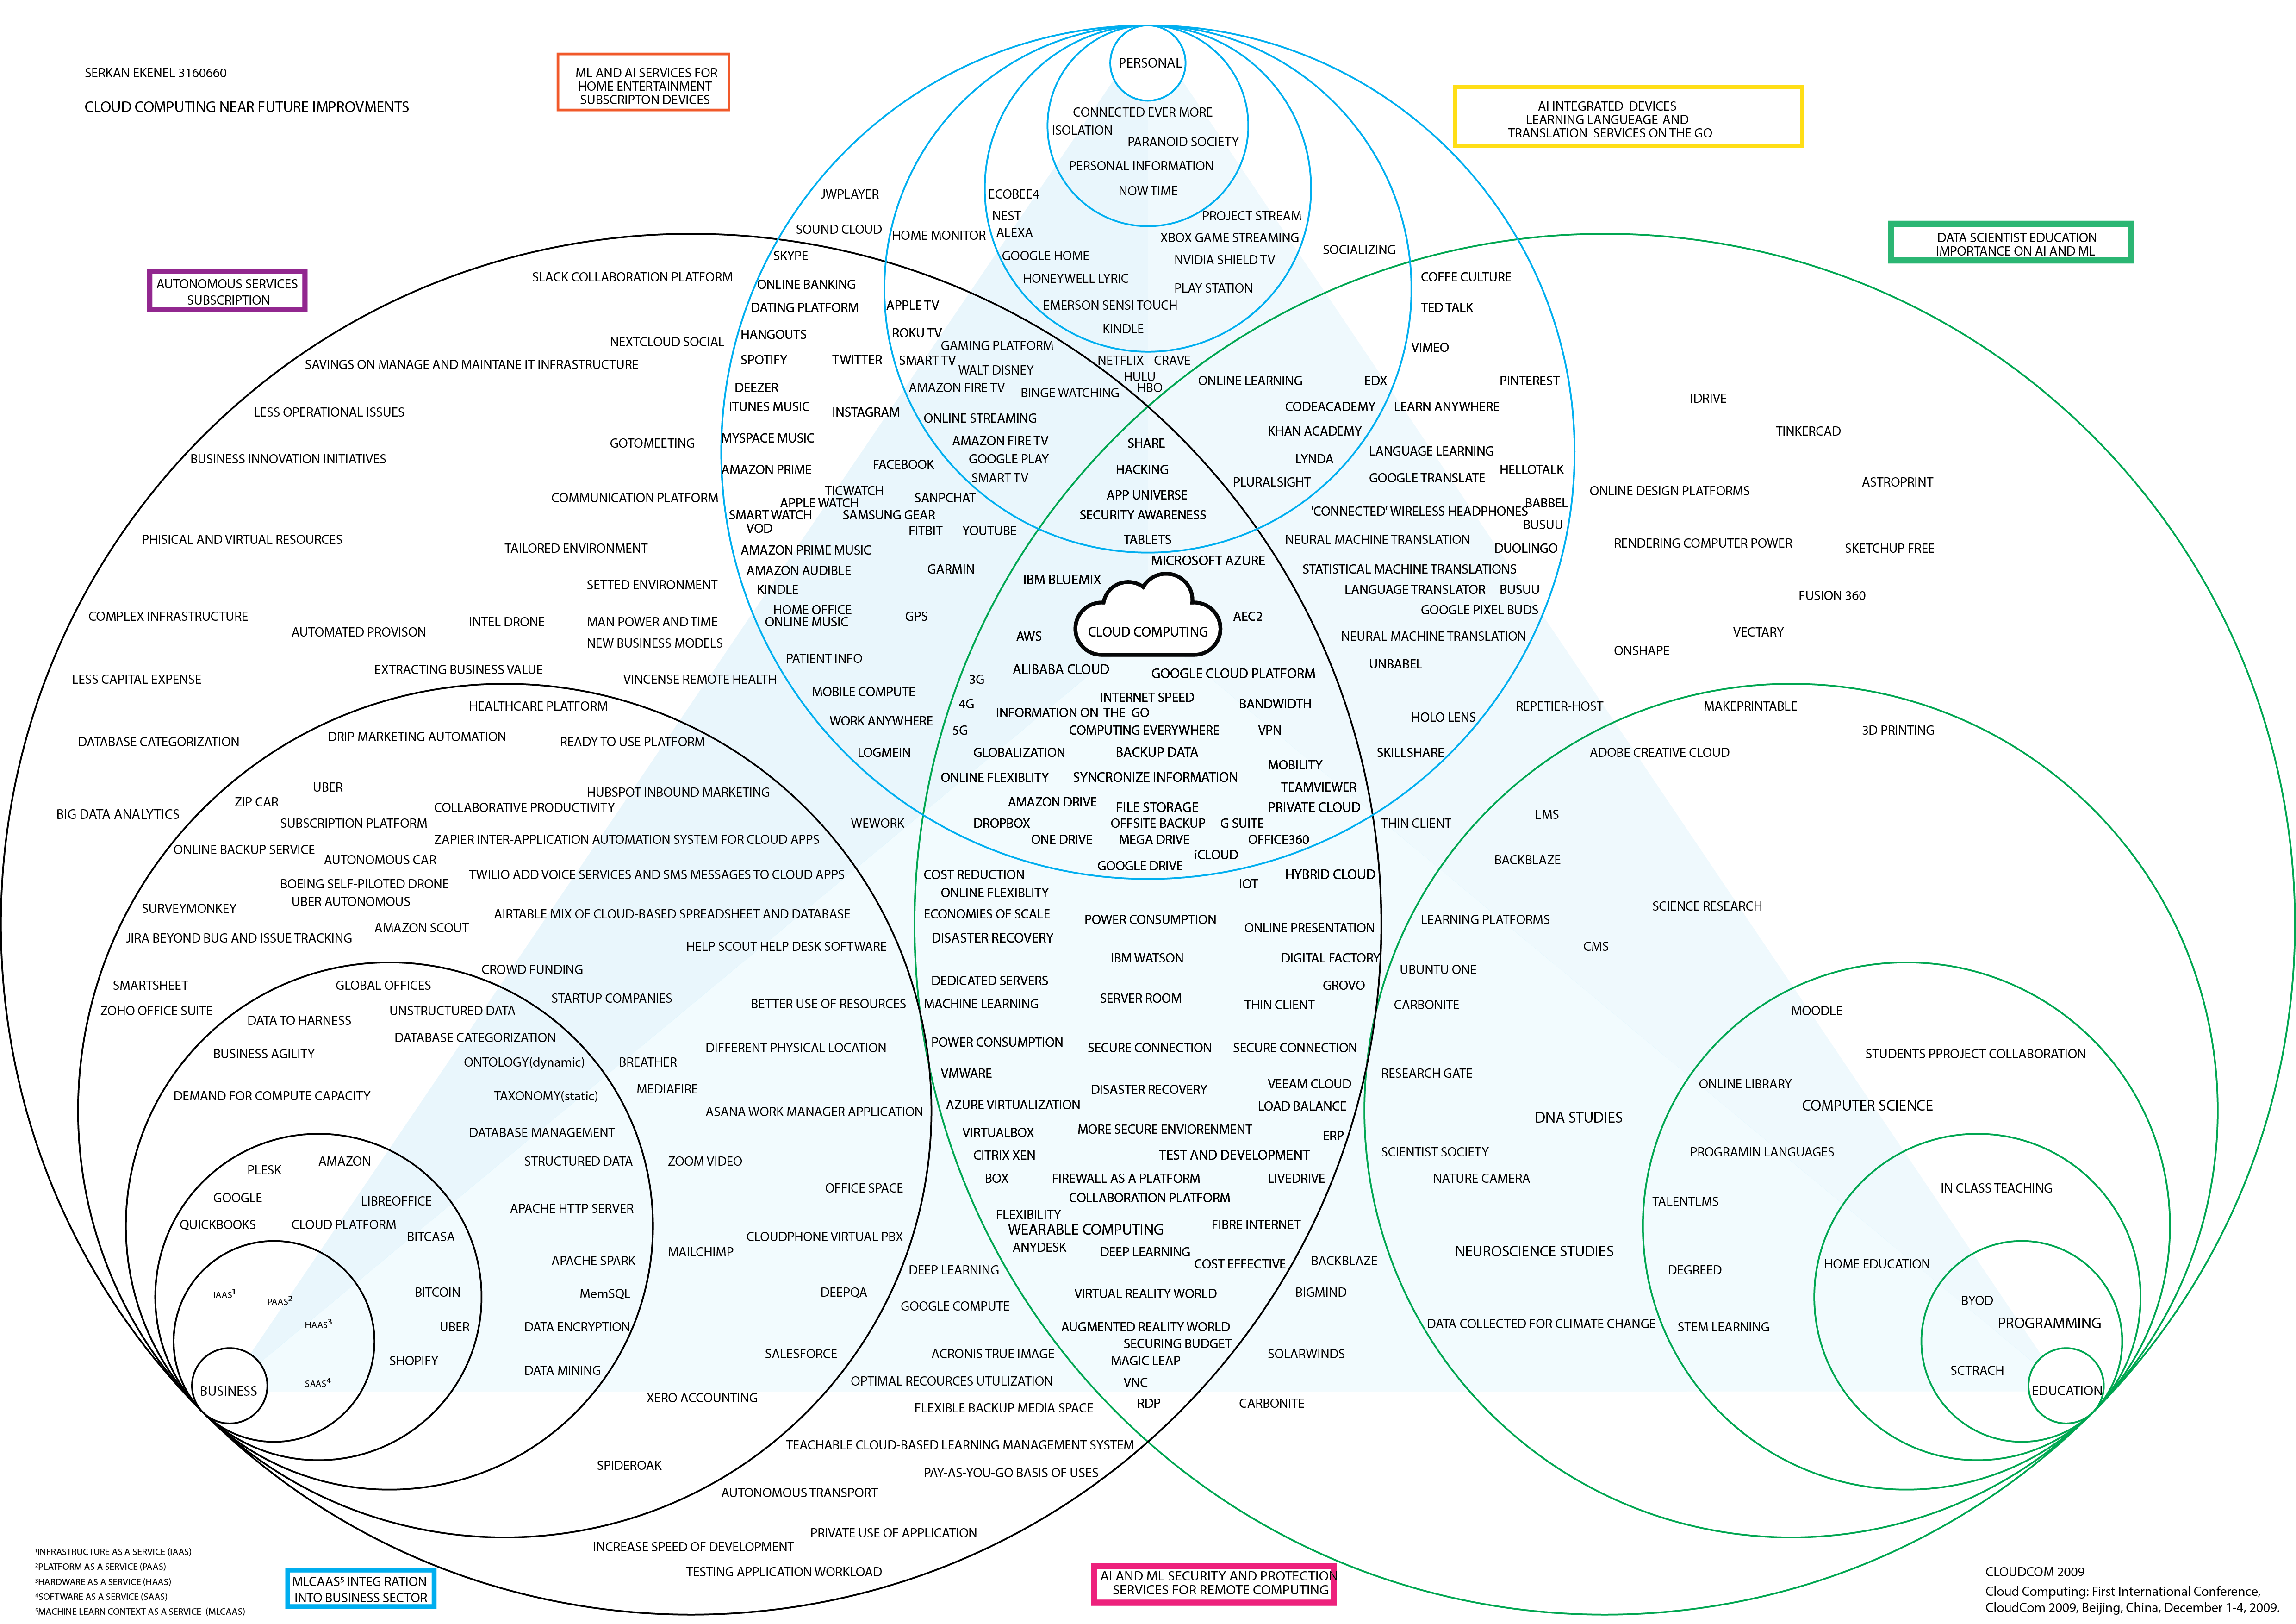
Mapping the Behaviour Economy of Cloud Computing across Business, Education, and Personal sectors. These progressive mind-map diagrams — titled Cloud Computing Near Future Improvements — demonstrate how human behaviour generates demand, and how that demand is answered by products and services built on cloud infrastructure. The map is not an inventory of technology. It is a spatial argument about cause and effect: behaviour comes first, services follow, and the distance between any two items on the map reflects the directness of that causal relationship.
Exploration
This map demonstrates the emerging context and scoping while mapping the changes in the economic and societal context over the past 10 years (2009–2019). The purpose is to train our ability to recognise emergent data points (Cloud Computing) and reflect them in a visual map that discloses the full data set of the behaviour economy.
The Innovation Object for this mapping exercise is Data as Material (Cloud Computing) as well as the Behaviour Economy — the roles of cloud computing in different sectors. The map represents the interplay of the data points with each other.
This is an opportunity to experiment with mapping as a model of thinking and visualising the whole ecosystem — the immediate as well as the macro ecology of the behaviour economy. This visualisation allows us to experience at one glance the complexity of product systems and subsystems, and the interrelationship between parts of the system.
How Behaviour Creates Products and Services
Every item on this map began as a behaviour, not a technology. People wanted to stay connected regardless of location — cloud storage appeared. People felt the anxiety of being constantly reachable — privacy tools appeared. People wanted to learn languages without attending classes — Duolingo, Babbel, and Busuu appeared. The map makes this sequence visible: behavioural tensions sit at the innermost rings of each sphere; the products and services that respond to them radiate outward in order of distance from that original human impulse.
The three sphere labels — Personal, Business, Education — are not industry categories. They are behavioural contexts. Personal describes how individuals experience and respond to connectivity in daily life. Business describes how organisations convert that connectivity into operational and commercial value. Education describes how society reproduces the knowledge and skills that make both of the other contexts possible. Cloud computing is the substrate all three share — which is why AWS, Azure, Google Cloud Platform, and IBM Bluemix appear at the geometric centre of the diagram, touching every sphere equally.
Reading the Map: Proximity as Meaning
Each sphere is drawn as concentric circles. Position within those rings is not decorative — it encodes a hierarchy of intimacy and dependency. Items closest to a sphere’s centre are its most foundational, identity-defining elements. Items sitting near or on the boundary line of a sphere are liminal: they are actively shared with an adjacent sphere, or on the threshold of becoming so. Items sitting between two boundary lines simultaneously serve both spheres.
The closer a service sits to a boundary, the more it has been generalised, commoditised, or expanded by its original market pressure. Services begin life deep inside a single sphere — purpose-built for one behavioural context. Over time, cloud infrastructure enables them to migrate outward and cross into adjacent spheres. Proximity in the map is therefore also a timeline: inner position means origin, outer position means maturity and crossover.
The Three Core Spheres — Ring by Ring
Each sphere is read from its innermost behavioural identity outward to its boundary, where it begins to overlap with adjacent spheres and generate new service categories.
How the Spheres Interact
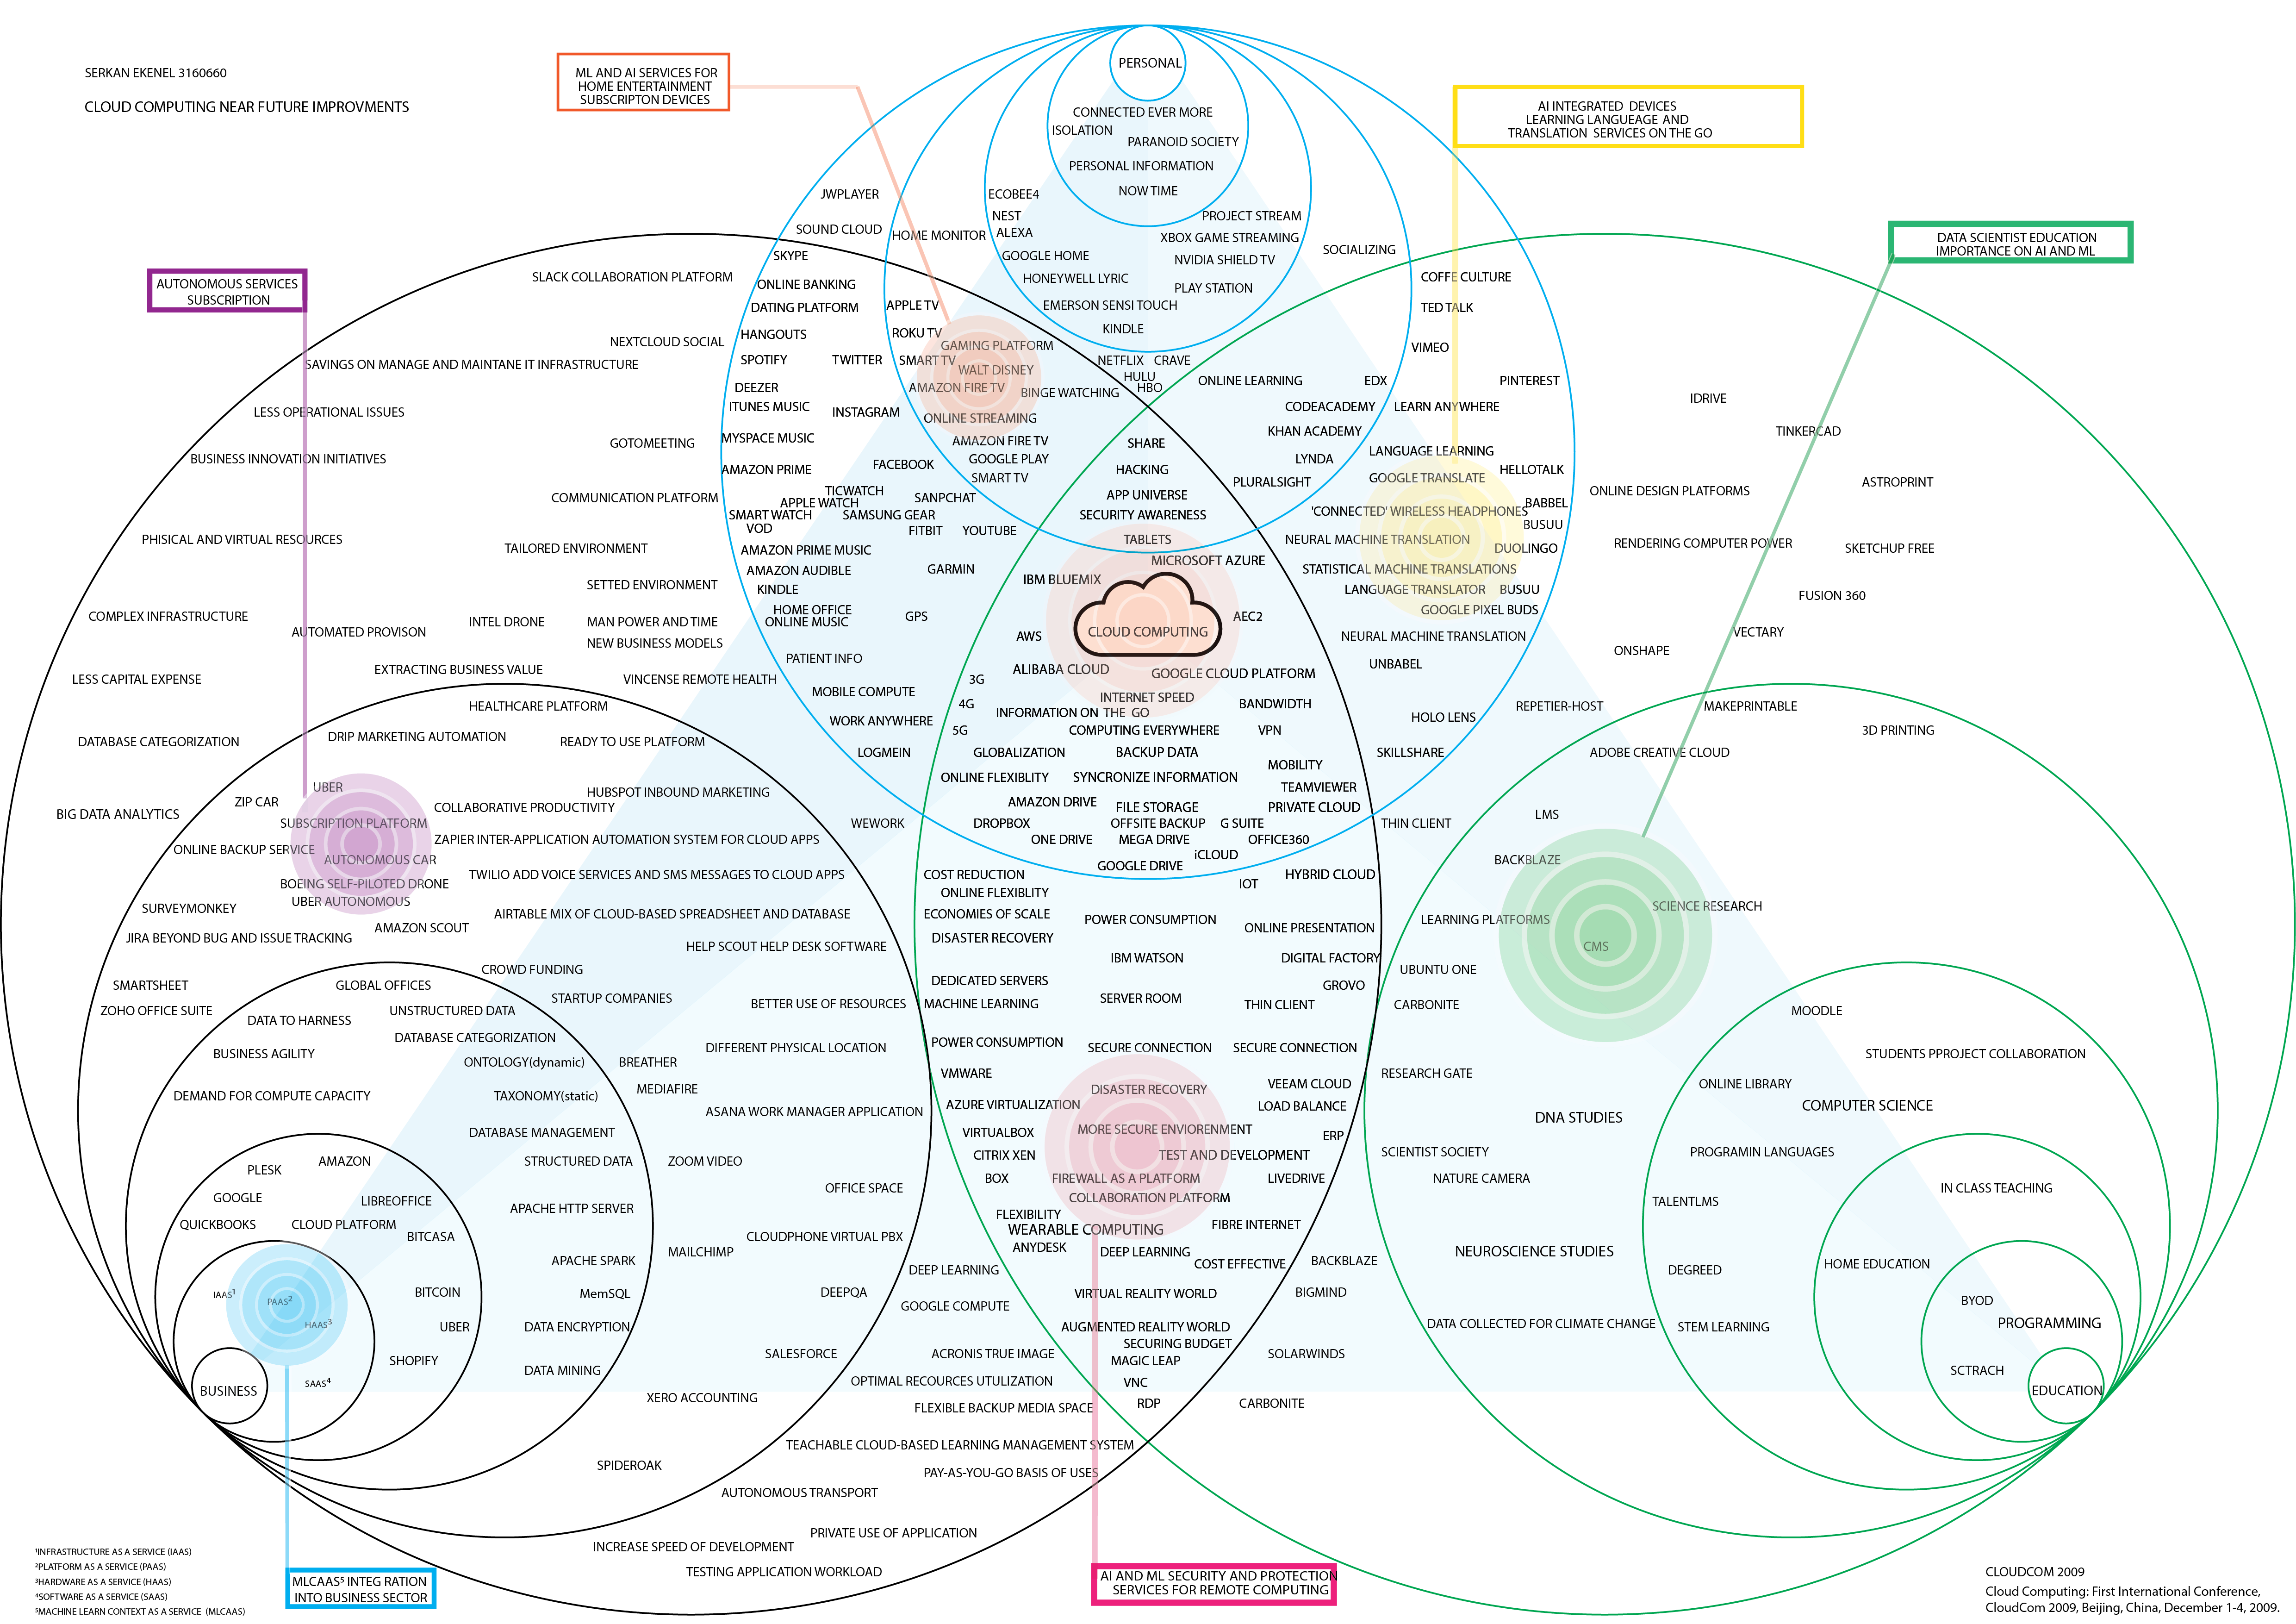
The three spheres are not isolated. They overlap through cloud computing as a common backbone, and the map makes these overlaps spatially precise. As the diagrams progress from Map 04 to Map 10, new connection lines and colour highlights trace the actual routes services travel from one sphere’s boundary into another.
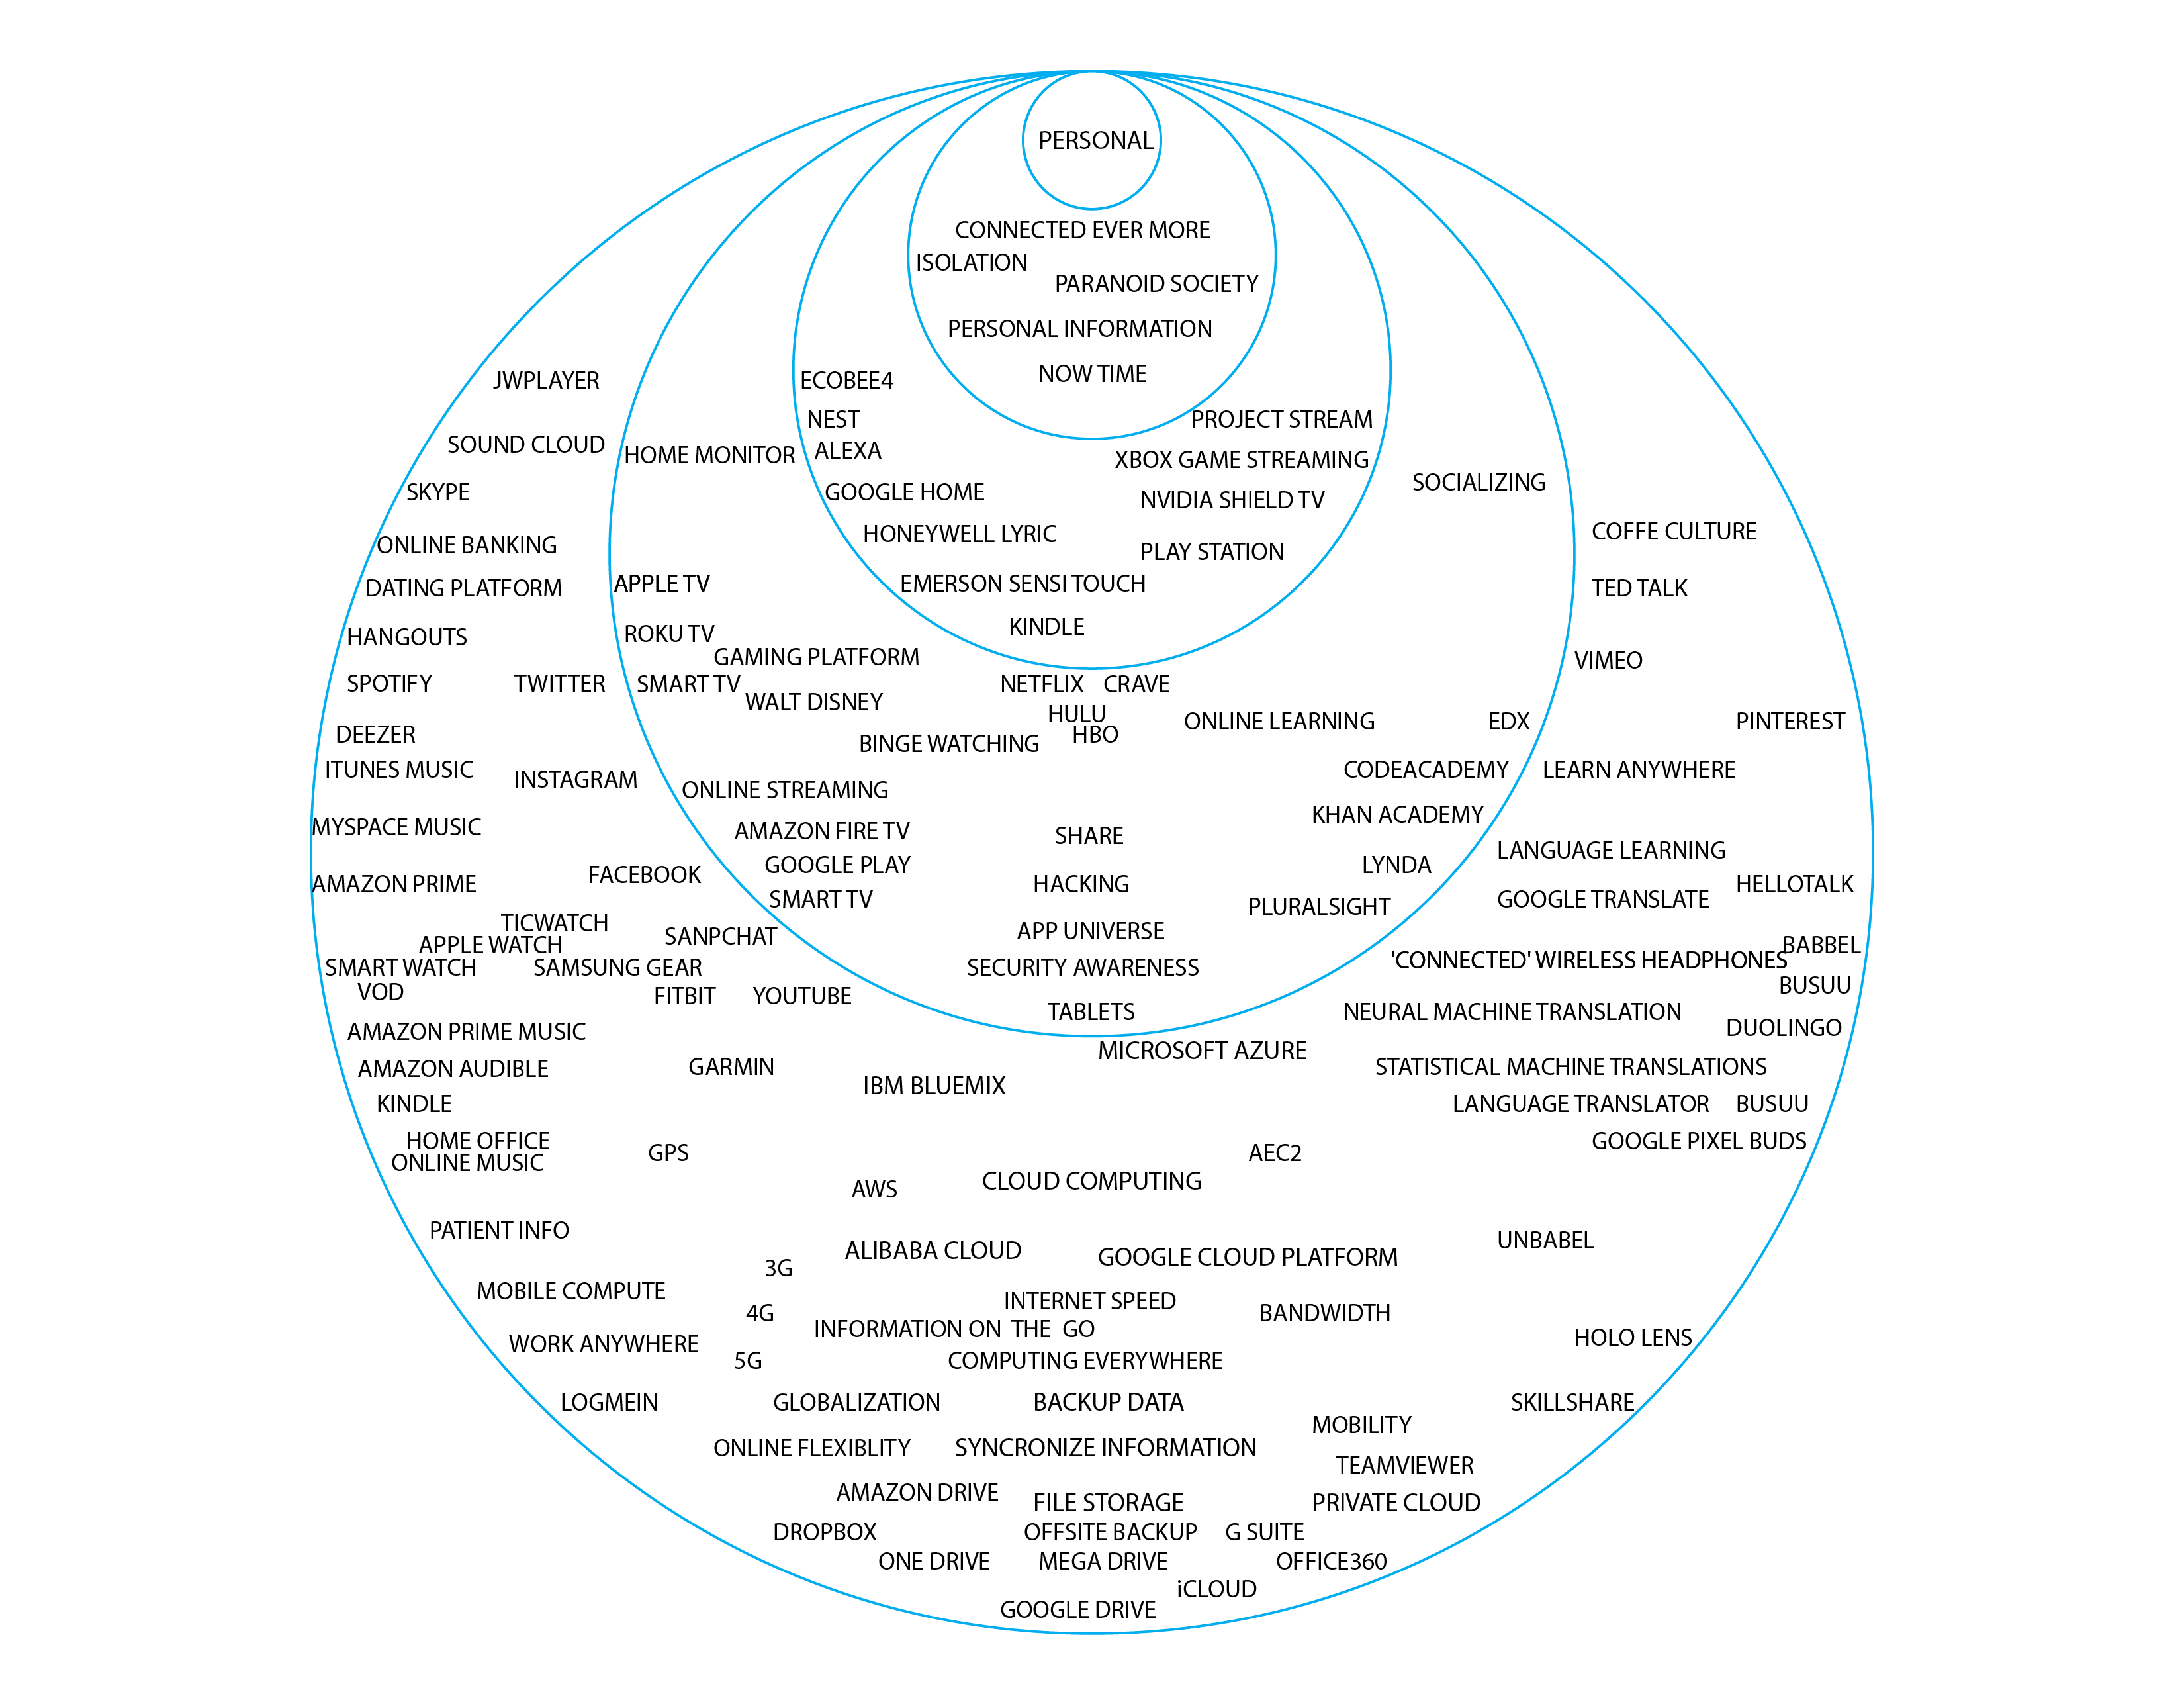
Personal ↔ Education boundary: Language learning tools (Duolingo, Babbel, Busuu, Google Translate, Hellotalk) and platforms (Khan Academy, EDX, Codeacademy) sit precisely on the shared edge. They started as Personal tools — casual, consumer-facing — but their pedagogical depth placed them at the Education boundary simultaneously. Google Pixel Buds, placed at this same boundary, signals the next product evolution: translation hardware embedded in consumer earwear. The “AI Integrated Devices — Learning Language and Translation Services on the Go” callout in Maps 09–10 formalises this as a distinct commercial category that behaviour created and technology answered.
Personal ↔ Business boundary: Wearable Computing, subscription platforms, and the autonomous vehicle cluster (Uber Autonomous, Boeing Self-Piloted Drone, Amazon Scout) sit in the overlap zone between Personal and Business. These services began as consumer lifestyle items but their logistics, data, and monetisation models are fundamentally commercial. The desire to have everything delivered, automated, and personalised is the behaviour; the subscription economy is the service it created.
Business ↔ Education boundary: Machine Learning, Deep Learning, IBM Watson, Digital Factory, LMS platforms, and maker/3D printing tools all cluster at this edge. The behaviour driving this boundary is the demand for skills that did not previously exist. Businesses need practitioners who understand AI and cloud infrastructure; educational institutions respond by building the curricula and tools that produce them. The “Data Scientist Education — Importance on AI and ML” callout names this boundary directly.
The three-way centre: AWS, Microsoft Azure, Google Cloud Platform, IBM Bluemix, and Alibaba Cloud appear at the geometric centre, equidistant from all three sphere centres. They are the infrastructure substrate — the material from which every other service in the map is made. No sphere owns them. All spheres depend on them.
Business Opportunities from Sphere Intersections
The richest commercial opportunities emerge precisely at boundary zones — where one sphere’s behaviours are close enough to another’s to create shared demand. Each opportunity below is named by the boundary it comes from, and grounded in the spatial evidence of the map.
Map Progression — What Each Diagram Adds
| Slide | What is shown | Key proximity signal |
|---|---|---|
| 01 — Personal Isolated | The Personal sphere at full scale without the other spheres. The five innermost data points read as a distinct psychological cluster. The right-hand arc (Socializing, Coffe Culture, Ted Talk, Vimeo, Pinterest) sits furthest from centre and closest to where Education will appear. | Read alone, Personal’s outer boundary already faces Education — culture and content-sharing services orient toward learning before any connection line exists. |
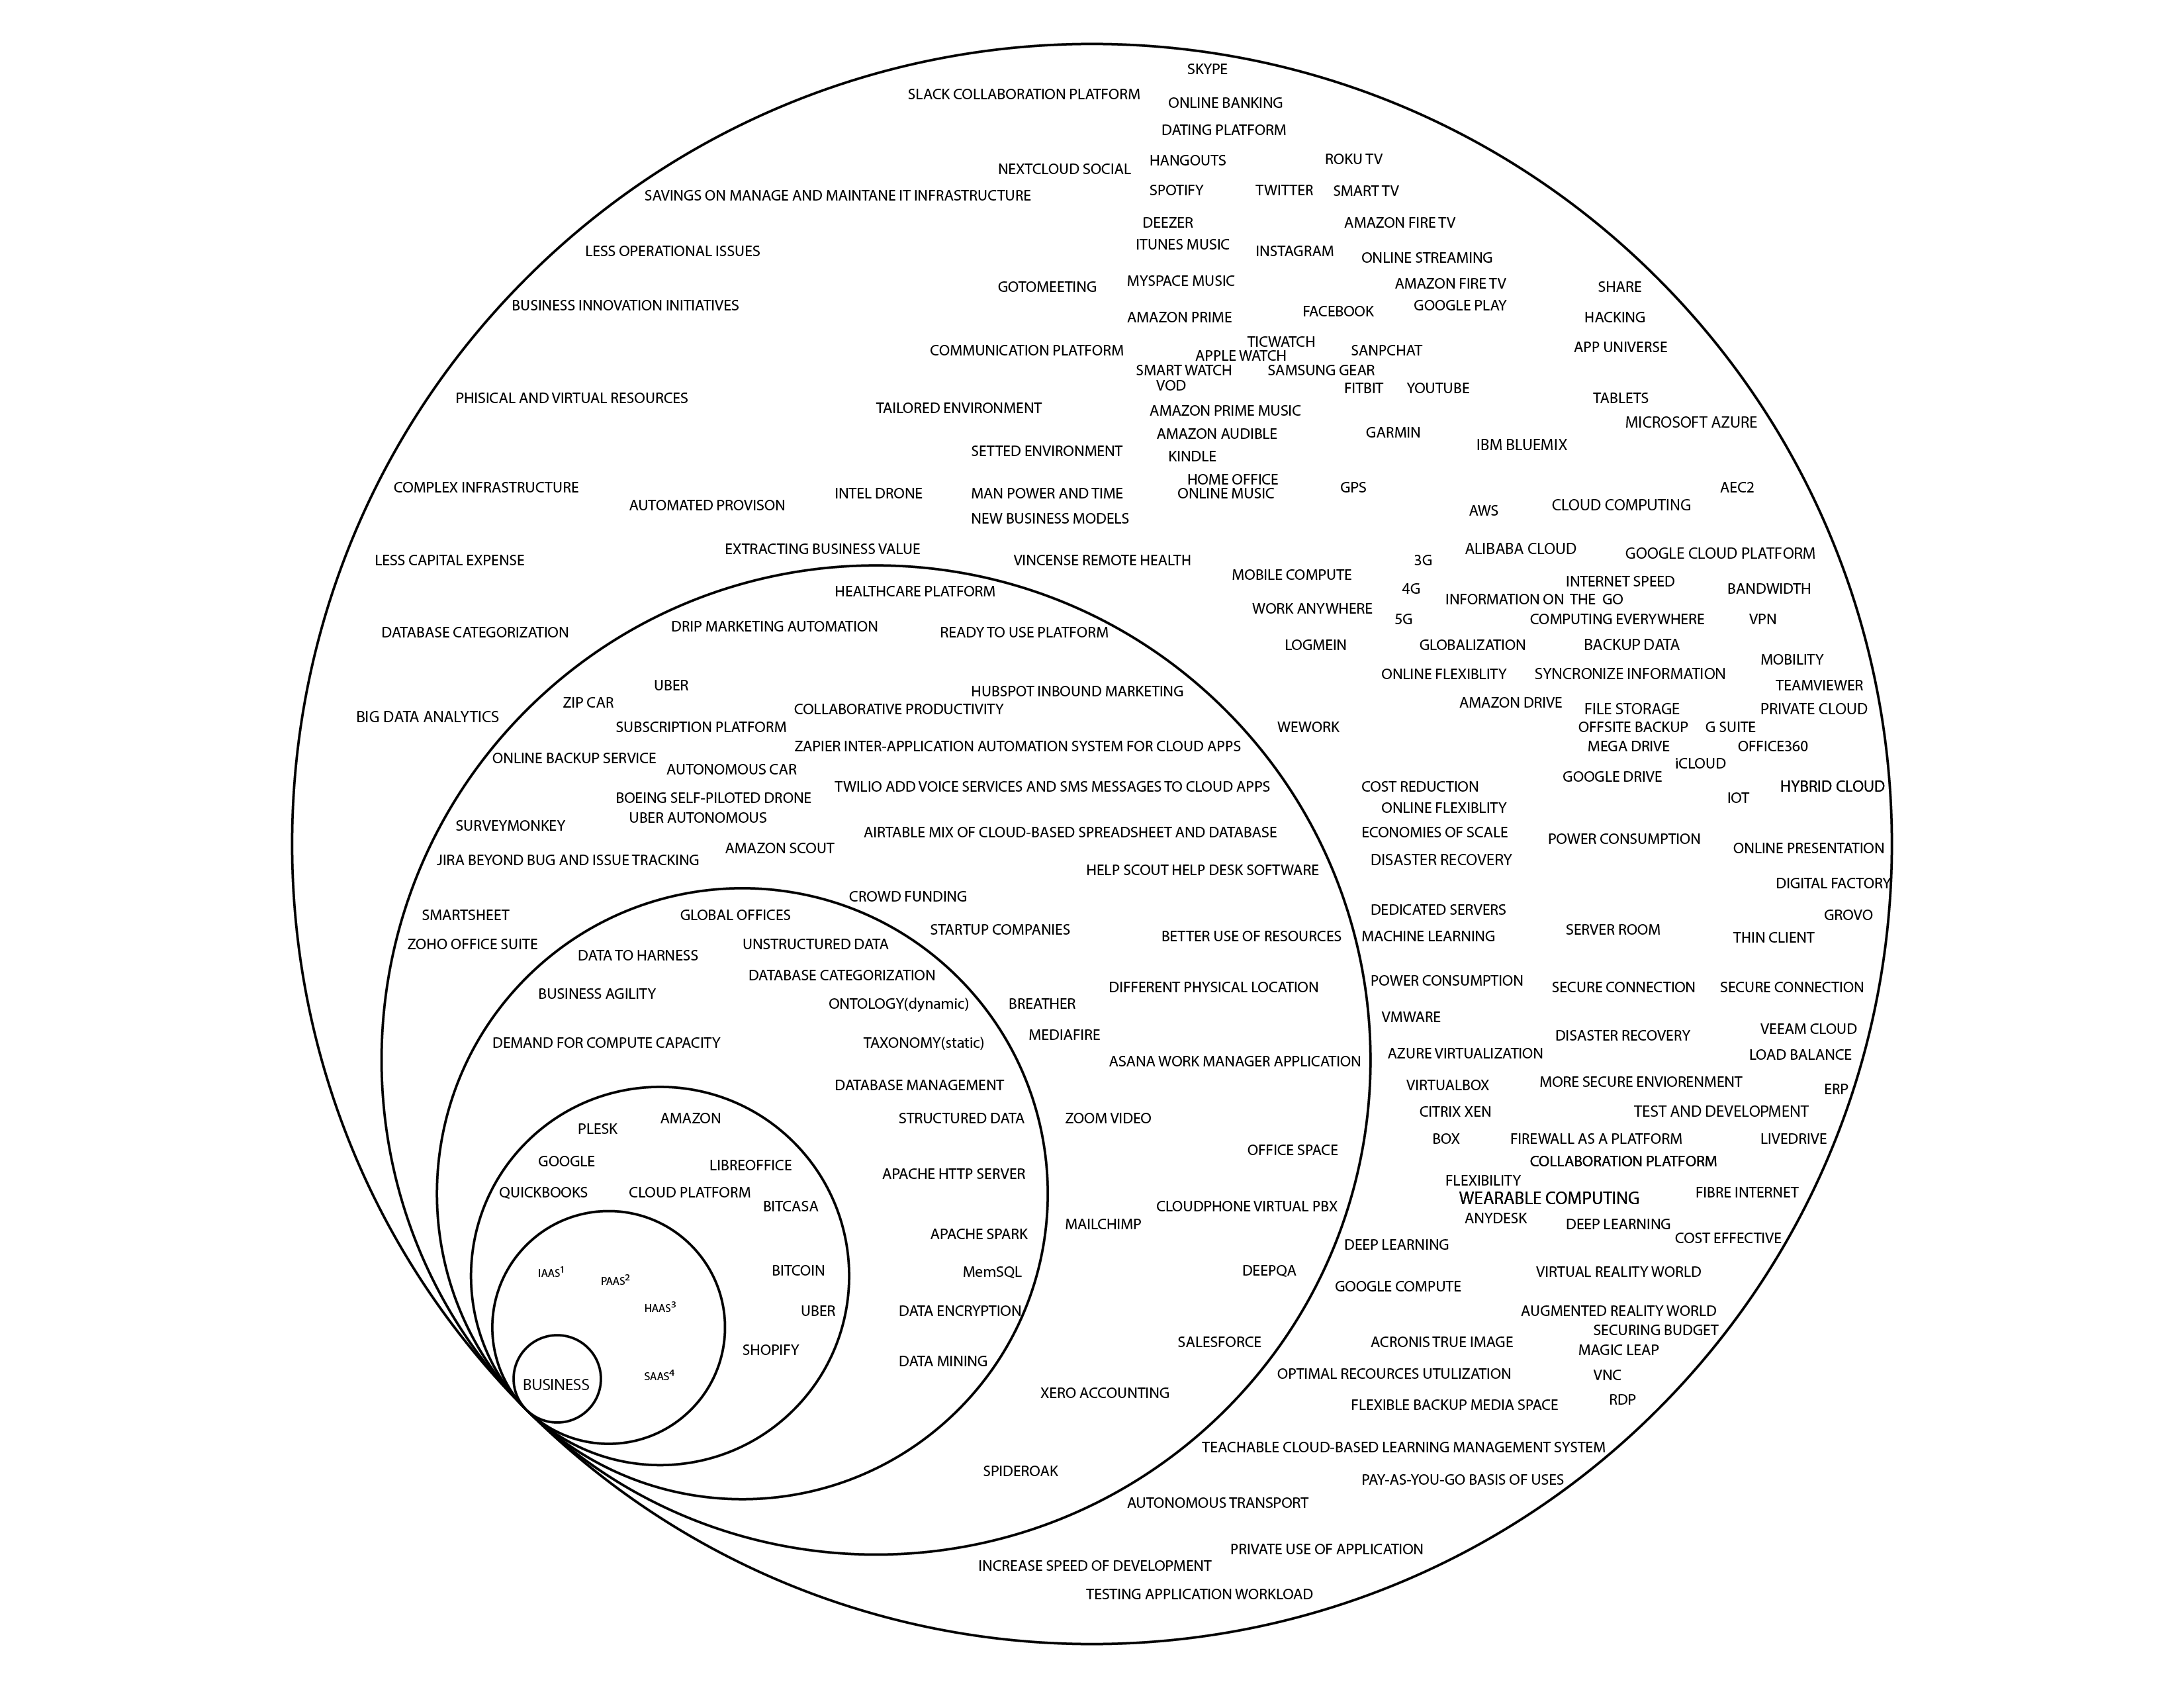
| 02 — Business Isolated | The Business sphere at full scale. The IaaS/PaaS/HaaS/SaaS innermost spiral is the tightest cluster in the entire diagram. The lower arc (Spideroak, Xero Accounting, Data Mining, Bitcoin) marks the outermost Business boundary furthest from all other spheres. | The compression of the service-model stack vs. the dispersal of the outer enterprise tools shows Business’s full operational range — from abstract infrastructure identity to concrete field deployment. |
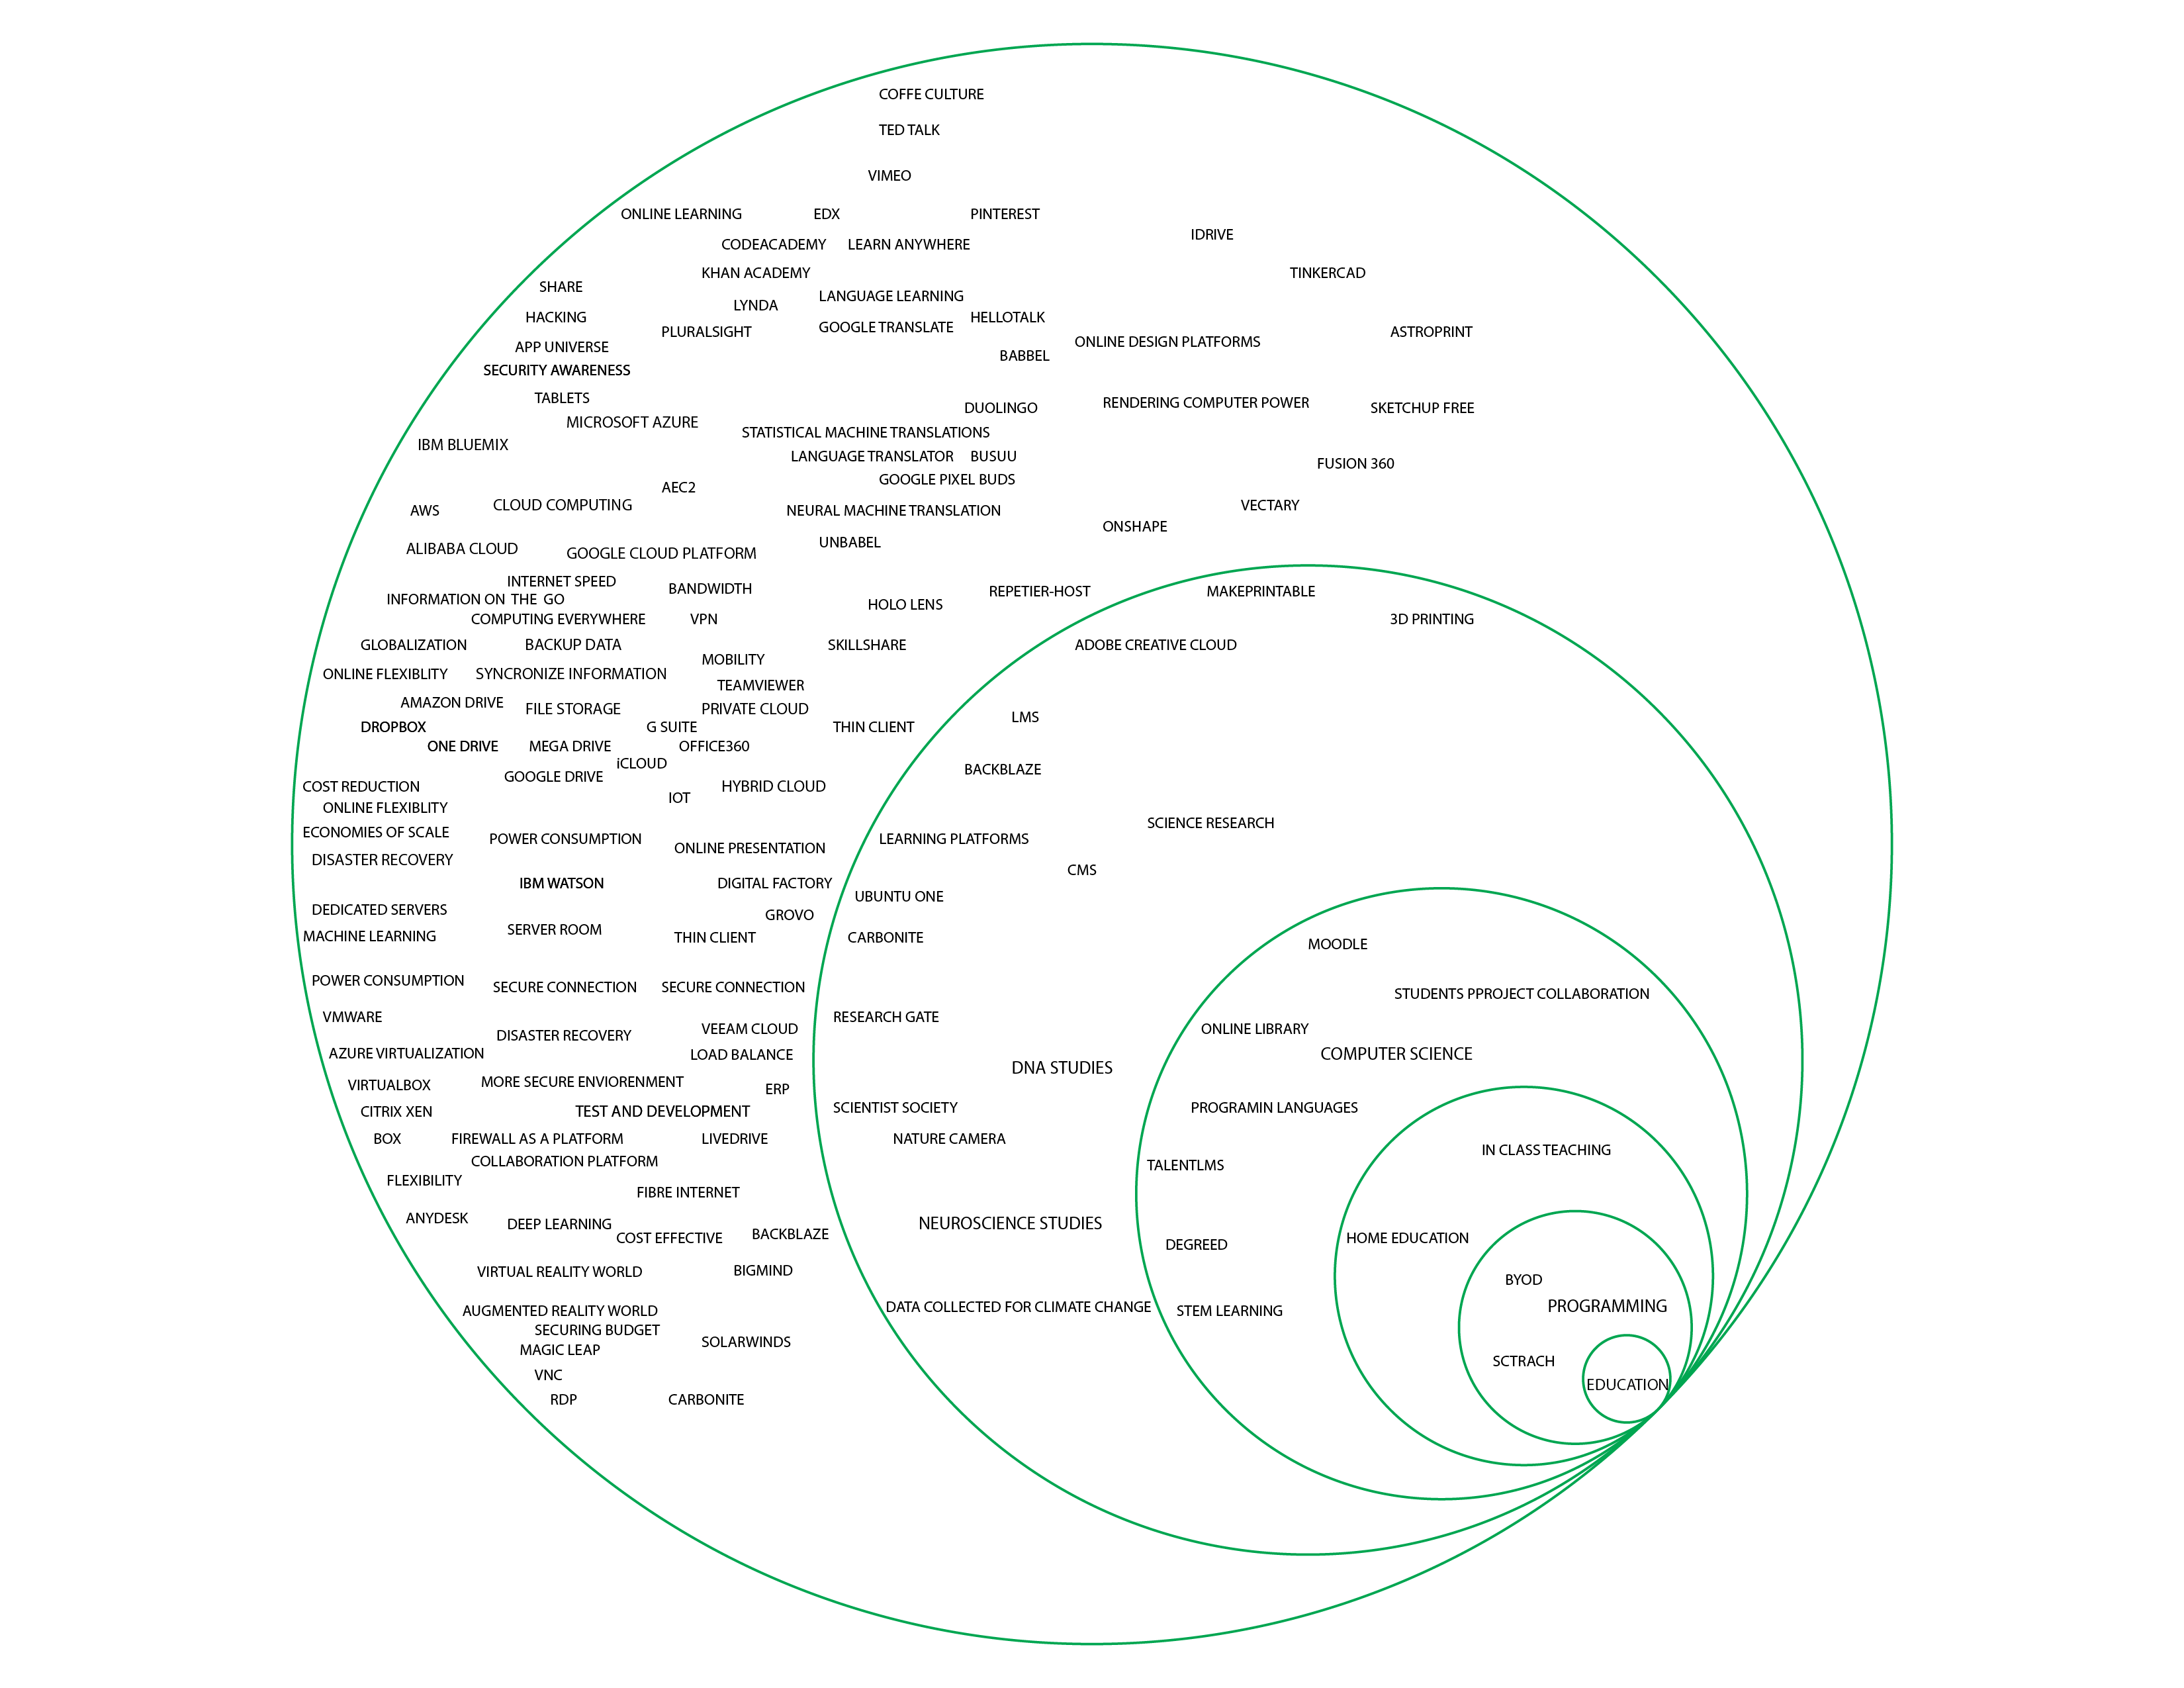
| 03 — Education Isolated | The Education sphere at full scale. The innermost cluster (Education, Programming, Scratch, BYOD) is the smallest tight grouping in the diagram. The right arc (TinkerCAD, Fusion 360, 3D Printing, Adobe Creative Cloud) is furthest from the Education core and closest to Business. | Education’s boundary arc is the most commercially legible of the three spheres — maker tools are already products in professional practice, confirming Business/Education as the most active zone of service creation. |
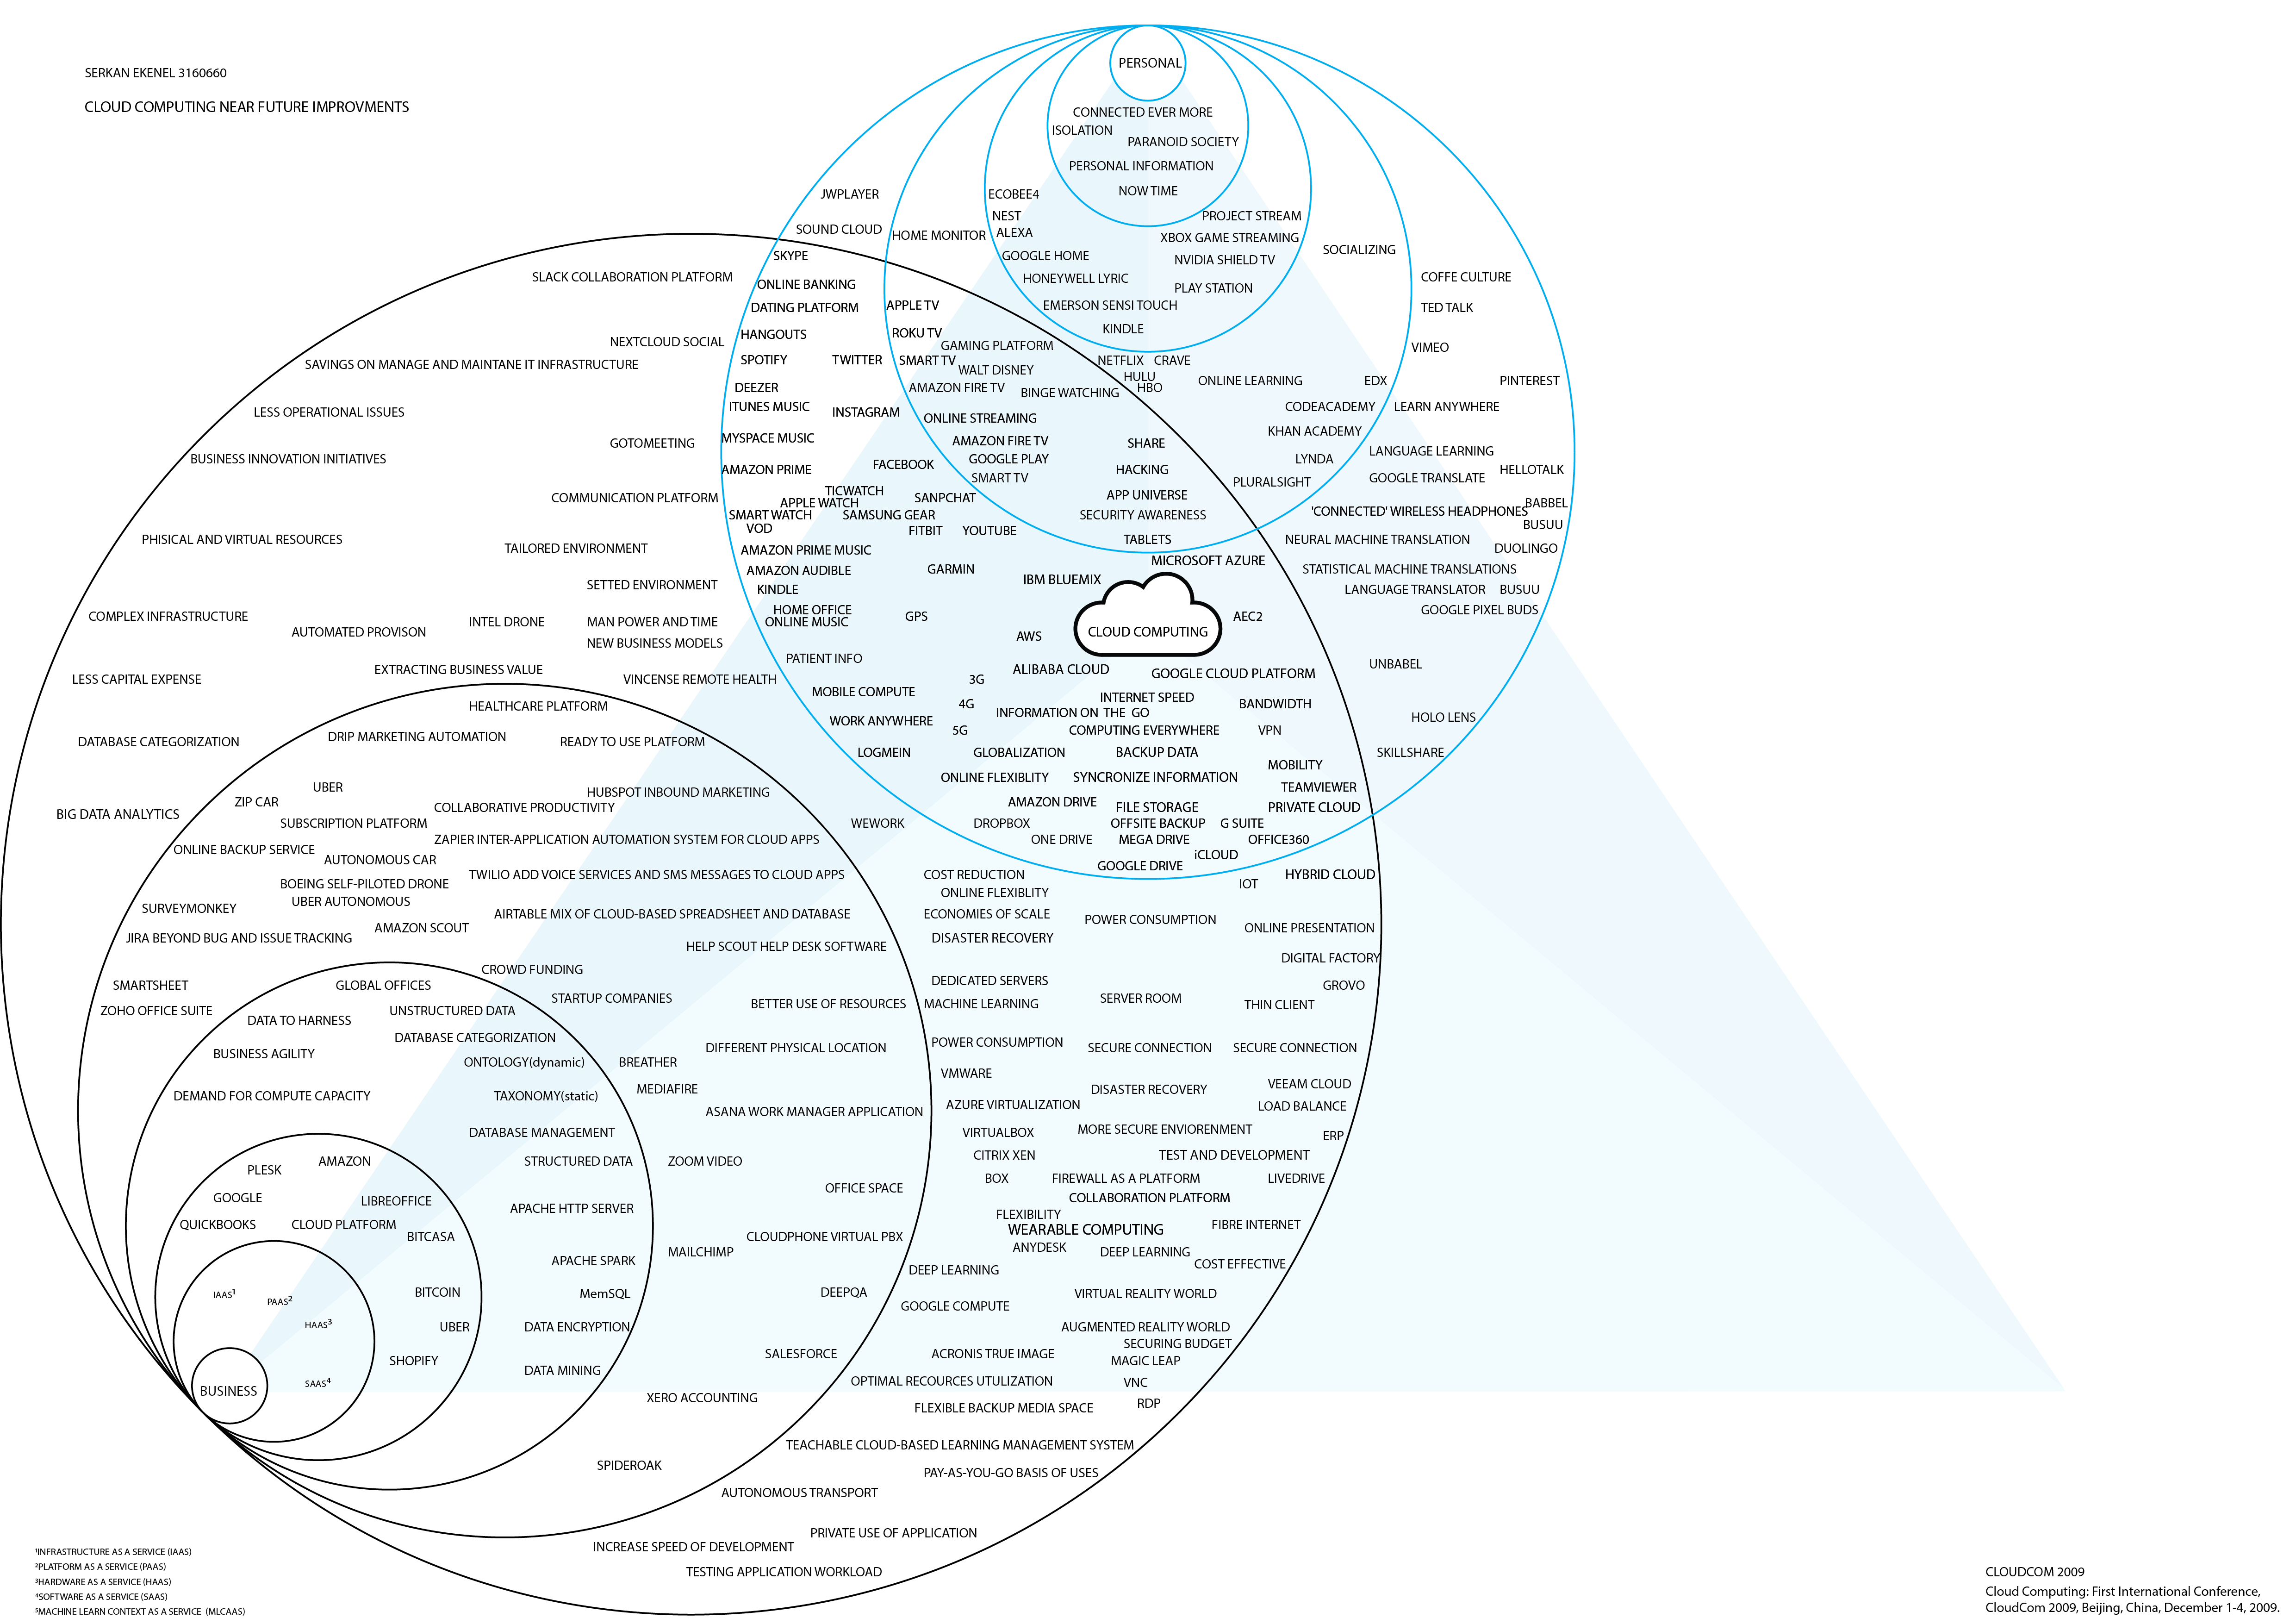
| 04 — Map 01: Personal Sphere | The Personal sphere drawn in the full diagram format. The behavioural tension cluster (Isolation, Paranoid Society, Connected Ever More) sits at the innermost ring — closer to the centre than any device or service. | Human psychological response to connectivity precedes technology in the spatial hierarchy. The behaviour is mapped before the product. |
| 05 — Map 02: Business Sphere Introduced | The Business spiral enters lower-left. Its tight nested IaaS/PaaS/HaaS/SaaS core contrasts with the Personal sphere’s emotional core — both innermost rings define what the sphere is. | Cloud service layers (IaaS → MLCaaS) are more tightly nested than any personal device cluster, reflecting Business’s infrastructure-first identity. |
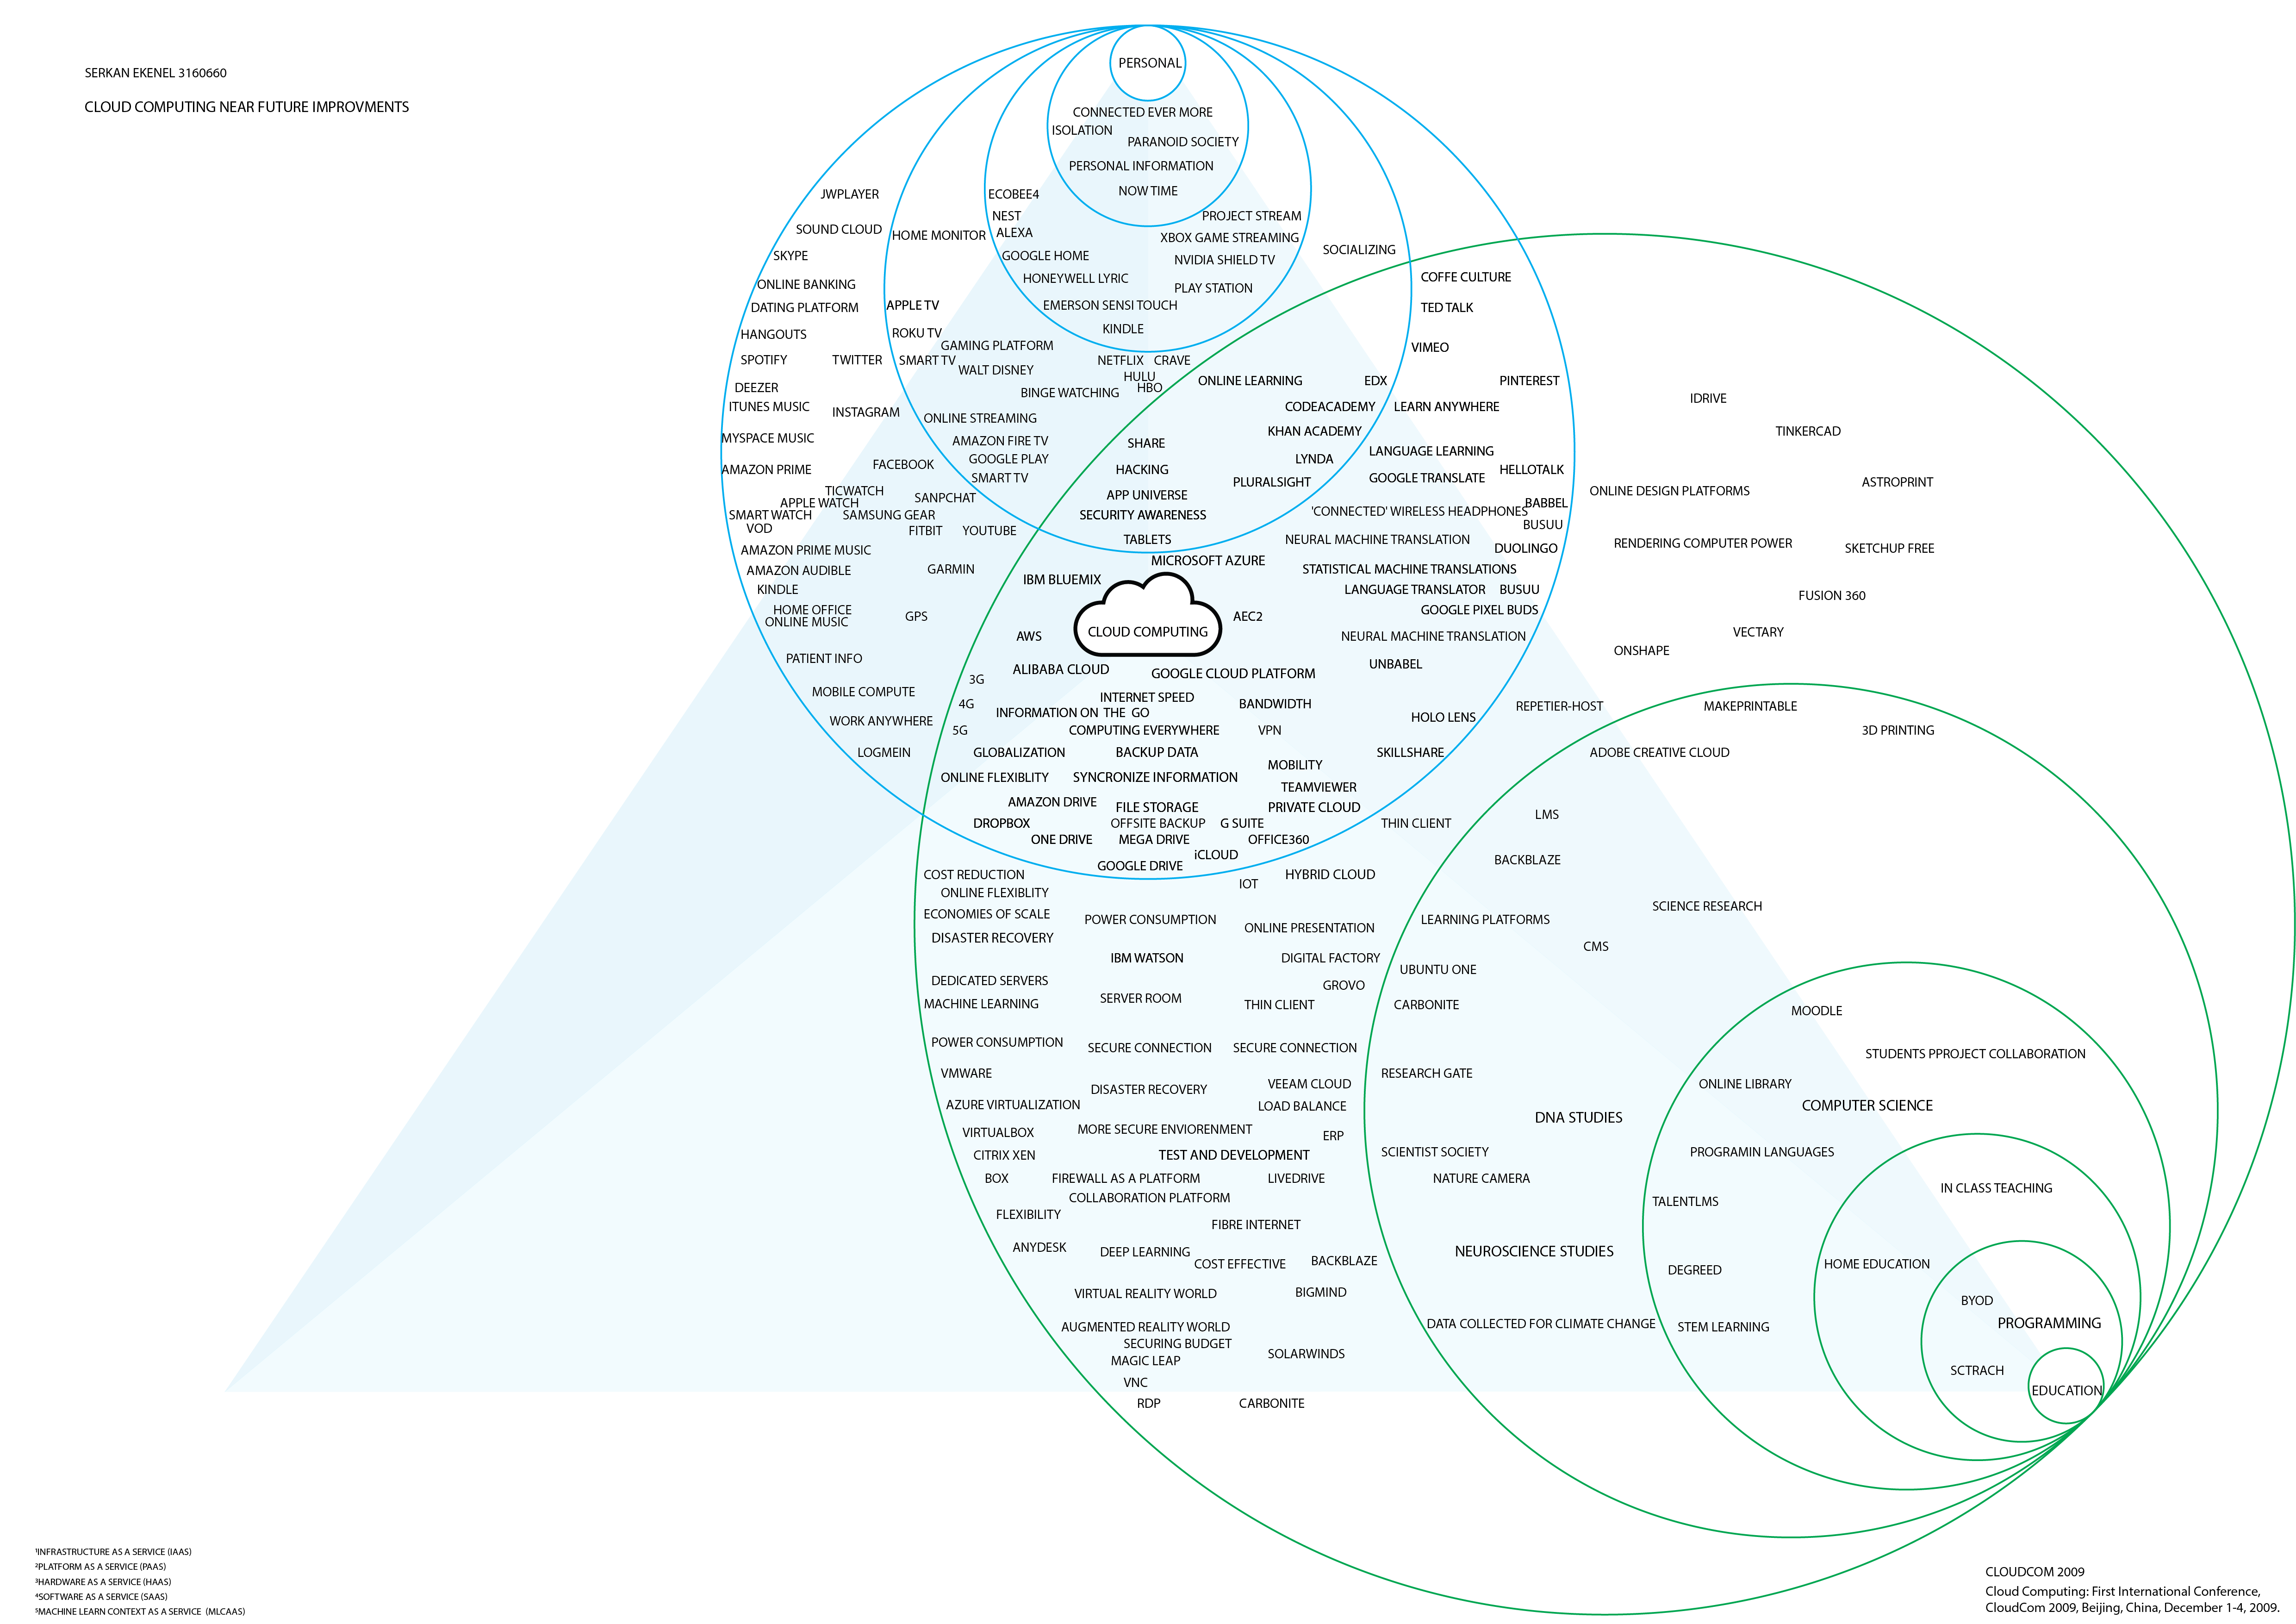
| 06 — Map 03: Education Sphere Introduced | Education is added lower-right with Programming and Scratch at core. STEM Learning, DNA Studies, and Neuroscience Studies occupy mid-rings. 3D printing and maker tools appear at the outer boundary. | Maker tools (TinkerCAD, Fusion 360, 3D Printing) sit at the Education boundary nearest Business — already liminal before the spheres formally connect. |
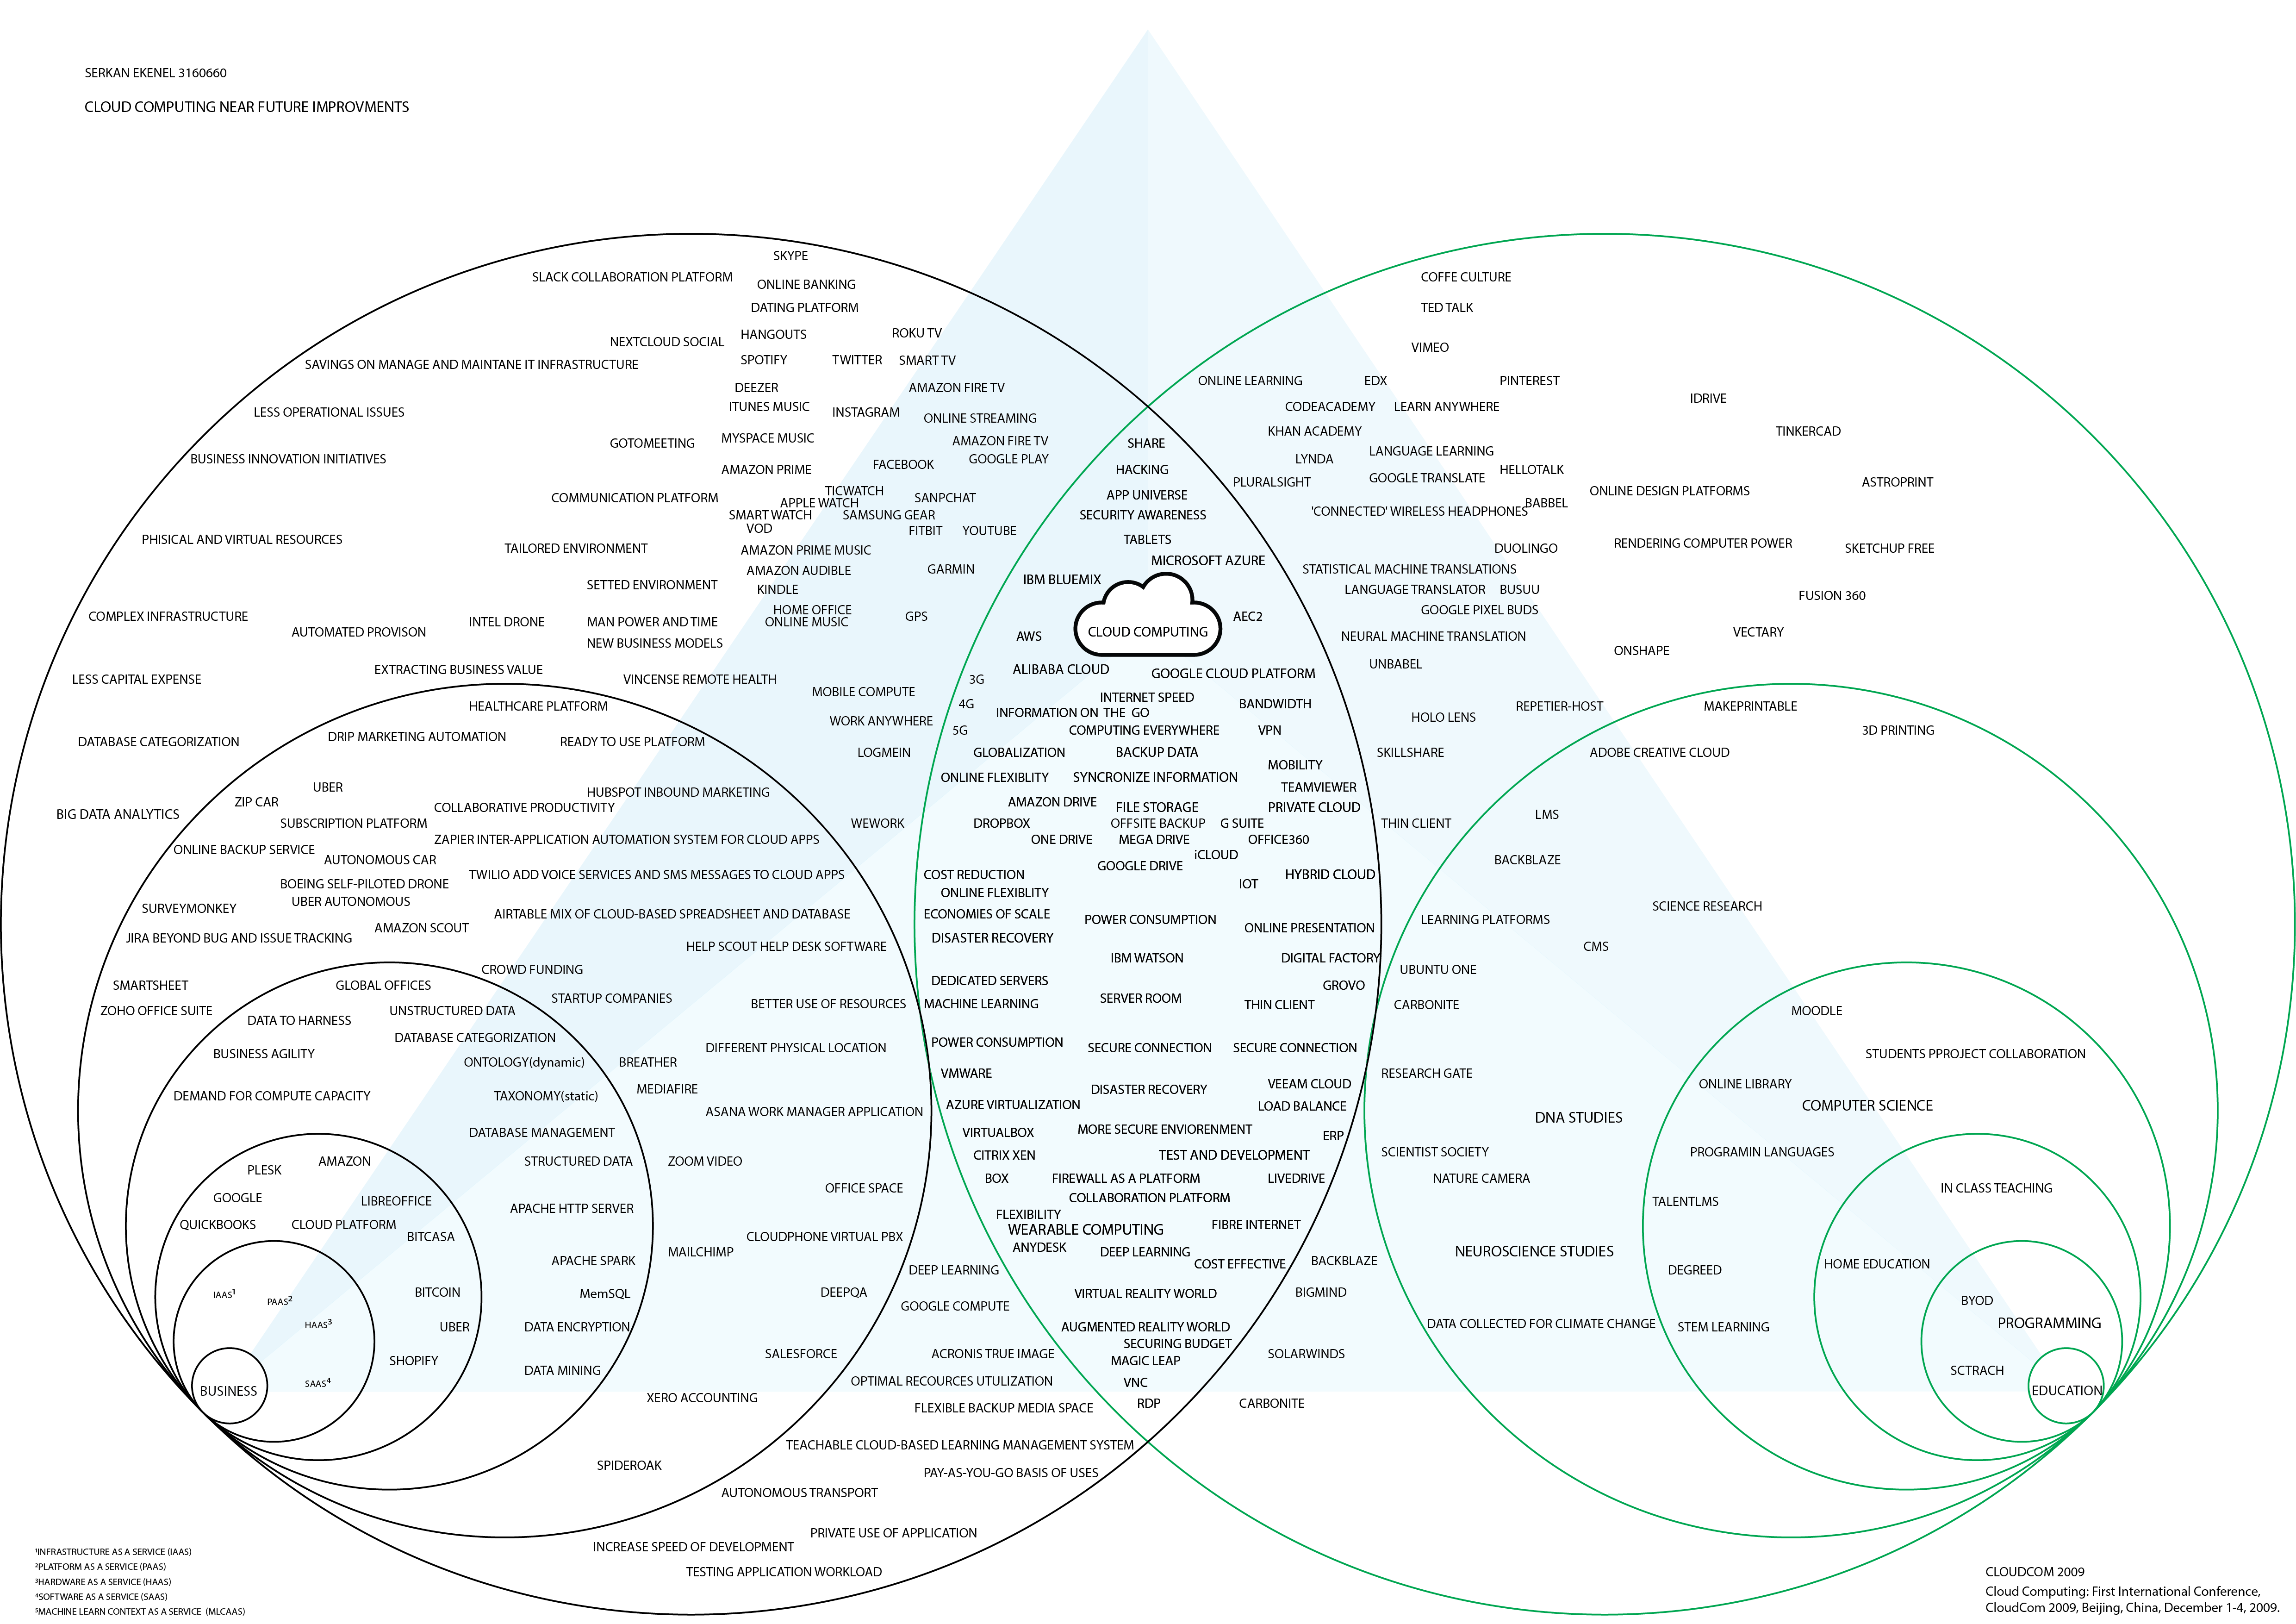
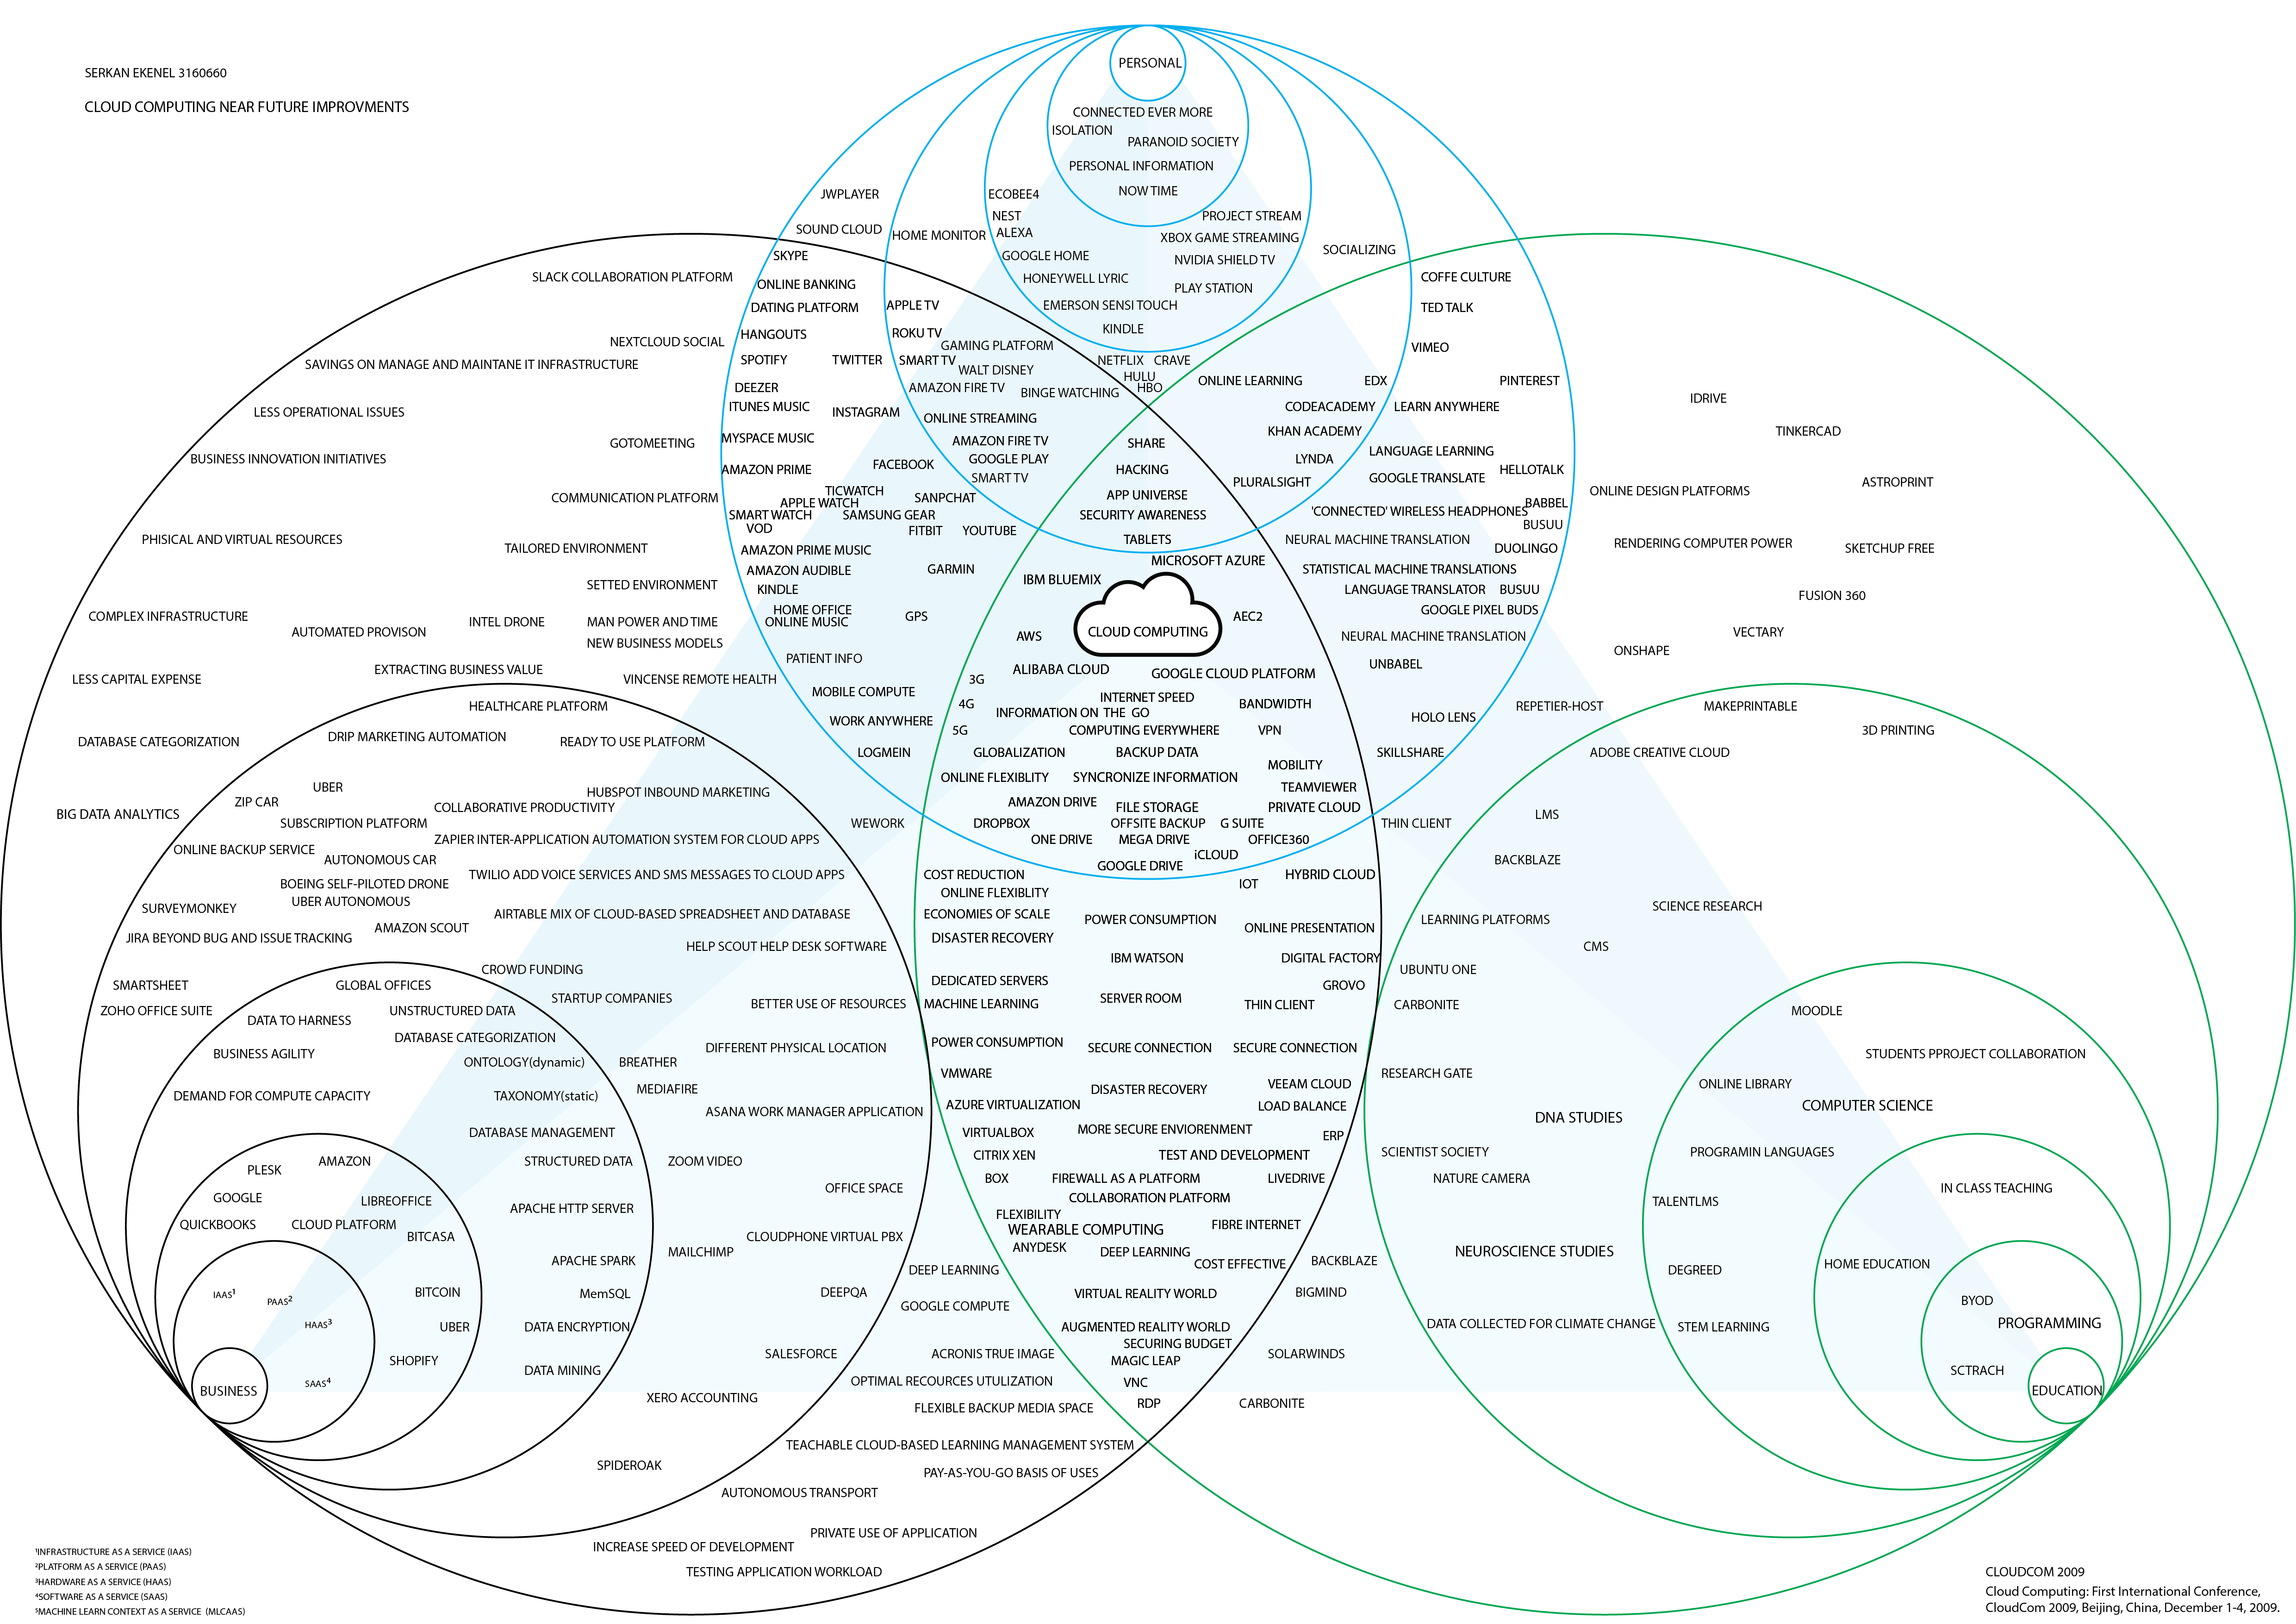
| 07 — Map 04: Full Three-Sphere Ecosystem | All three spheres visible simultaneously without connection lines. The shared infrastructure core (AWS, Azure, Google Cloud, IBM Bluemix) becomes legible as equidistant from all three sphere centres. | Wearable Computing, Machine Learning, and Deep Learning are visibly positioned in the overlap zone between Business and Education boundary lines. |
| 08 — Map 05: Sphere Overlaps | Identical layout to Map 04 — a deliberate reading pause. The viewer locates the liminal clusters unaided: language learning tools on the Personal/Education boundary; autonomous vehicles straddling Personal/Business; Machine Learning co-located on both Business and Education outer rings. | Proximity is a stable spatial fact, not an annotation. The repetition is the argument. |
| 09 — Map 06: Opportunity Callouts | Five annotated callout boxes added, each anchored to the boundary zone it names: ML & AI for Home Entertainment (Personal/Business); AI Integrated Devices for Language (Personal/Education); Data Scientist Education (Education/Business); AI & ML Security (centre); MLCaaS into Business Sector (Business core). | The spatial position of each callout label mirrors the proximity logic of the services it describes — the annotation confirms what the map already shows. |
| 10 — Map 07: Final Annotated Map | Coloured highlight overlays and directional connection lines drawn between spheres. PaaS highlighted in Business core (cyan); Gaming Platform/Online Streaming in Personal (salmon); language translation cluster at Personal/Education boundary; Disaster Recovery and More Secure Environment in the Business/centre zone (green). | Connection lines physically trace the path a service travels from one sphere’s boundary into another. Proximity becomes movement. The map becomes a prediction diagram. |
Maps & Visualisations